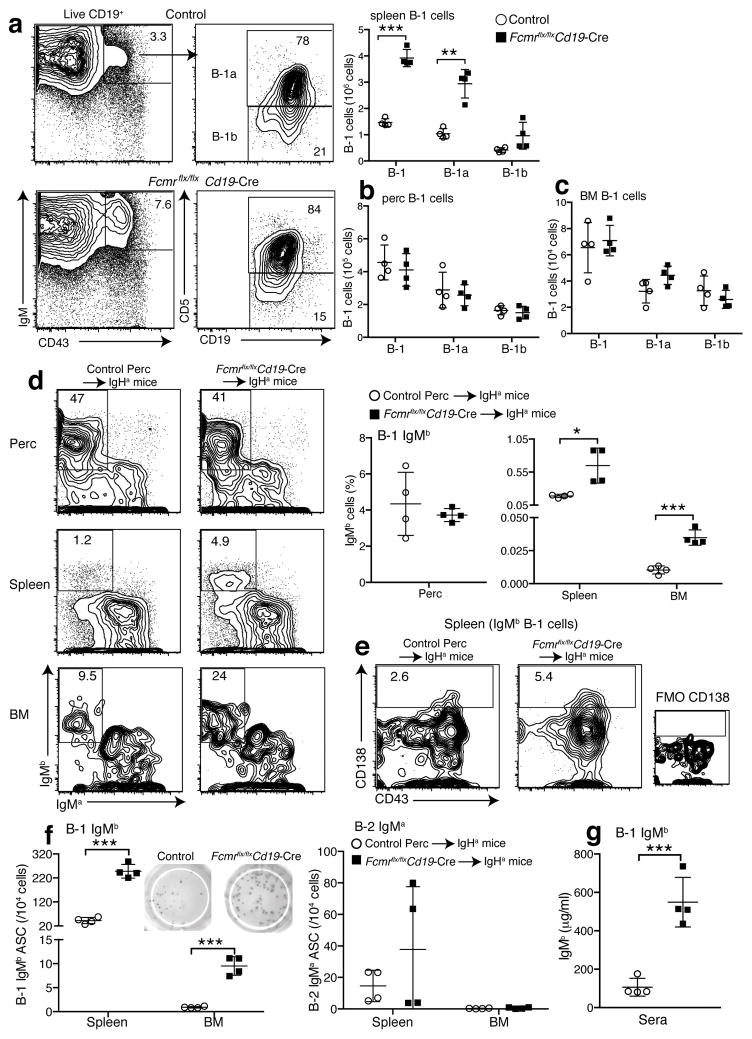
Figure 6. B-1 cells are responsible for increased natural IgM secretion in Fcmr flx/flxCd19-Cre mice.
(a) 5% contour plots with outliers gated for live CD19+ spleen B cells from control and Fcmr flx/flxCd19-Cre mice. B-1 cells were identified as: CD43+ IgMhi CD19hi and CD5+/− (B-1a/B-1b). Graph summarizes numbers of B-1 cells, including B-1a and B-1b cells in spleen, (b) peritoneal cavity and (c) BM (n=4 mice/group). (d–g) Generation of chimeras with Fcmr−/− B-1 (IgHb) and wild-type B-2 (IgHa) cells and controls (n=4 mice/group). (d) (left) 5% contour plots with outliers gated for lived CD19+ B cells from peritoneal cavities and spleens. For BM, cells were pre-gated for B-1 cells (CD19+ IgM+ CD43+). The transferred B-1 cells were identified as IgMb+ IgMa−. Graph provides summary of IgMb B-1 cell frequencies in indicated tissues. (e) 5% contour plots with outliers gated on IgMb+ B-1 cells in spleen. Gates and numbers identify frequencies of CD138+ of IgMb+ B-1 cells. FMO, fluorescence minus one control. (f) Graphs summarize the frequencies of IgMb secreting B-1 (left) and IgMa secreting B-2 cells (right) in spleen, and BMs. (g) Serum IgMb levels in the chimera. Data are representative of at least two independent experiments (a–c) (mean ± SD in a–d, f–g). *p<0.05, **p<0.005, ***p<0.0005 by unpaired two-tailed Student’s t-test.

