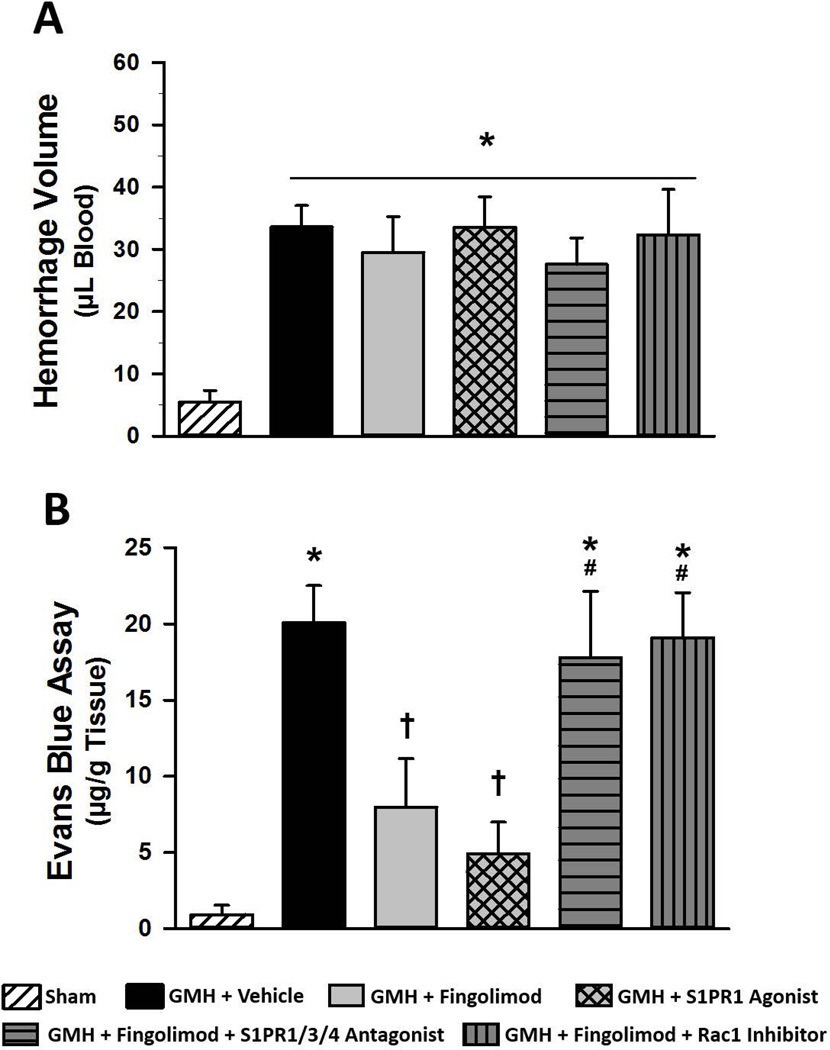
Figure 4.
Spectrophotometric quantification of brain extravasated Evans blue dye (A) and hemoglobin (B) at 72 hours after GMH in rats treated with fingolimod (1.0 mg/kg), the S1PR1 agonist, or in rats co-administered fingolimod with a S1PR1/3/4 antagonist or a Rac1 inhibitor. Representative images of brain sections are shown (C). Data expressed as mean ± SD. N=7 rats/group. * P<0.05 versus sham. † P<0.05 versus vehicle. # P<0.05 versus S1PR1 Agonist.

