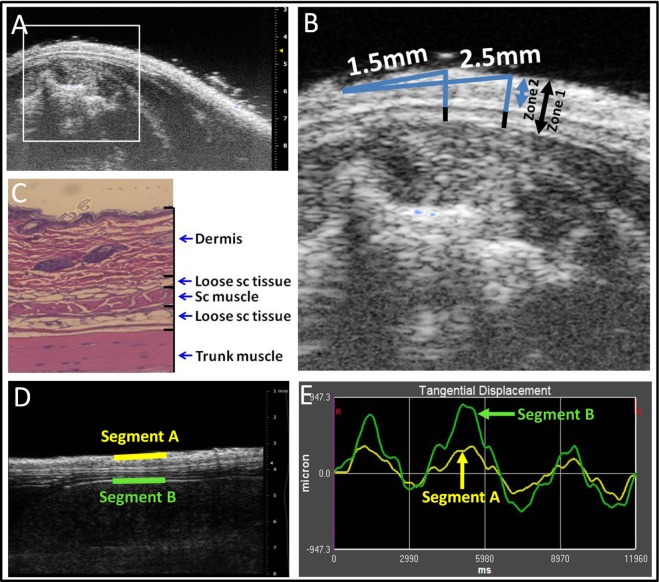
Figure 2.
Ultrasound image analysis methods. (A–C): ultrasound thickness measurements. Medial and lateral locations are, respectively, 1.5 and 2.5 mm from the midline (A,B). Zones 1–3 are shown in ultrasound (B) and corresponding histology (C) image shows relation to dermis, loose subcutaneous (sc) tissue, subcutaneous (sc) muscle, and trunk muscle (erector spinae). (D,E): Ultrasound measurement of tissue differential displacement. Segments a and b are, respectively, located on the superficial border of the dermis and the superficial border of the erector spinae perimuscular fascia. (E): representative tracing of tangential displacement of superficial and deep segments shown in (D) (segment A yellow and segment B green).

