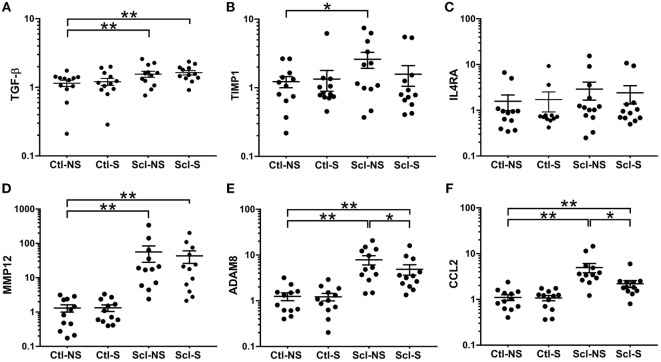
Figure 6.
mRNA expression (qPCR) analyses. (A–F): Significance levels for sclGvHD/no stretch and sclGvHD/stretch groups are shown relative to control/no stretch (Ctl-NS) group (*p < 0.05, **p < 0.01, N = 12 mice per group). There were no significant differences between Ctl-NS and Ctl/stretch groups for any of the outcome measures. Results are presented as geometric means and associated SEs, with the y-axis reflecting log scale.

