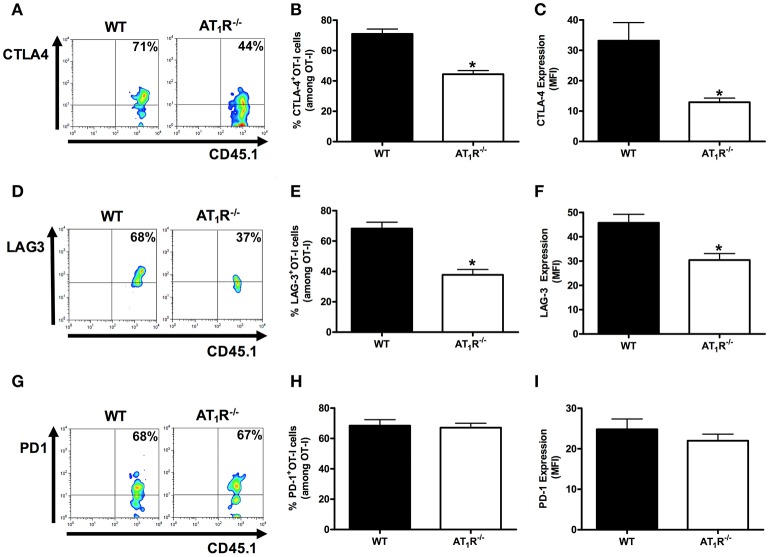
Figure 5.
AT1R induces exhaustion of Plasmodium-specific CD8+ T cells. The percentage of cells expressing exhaustion markers, PD-1, LAG-3, and CTLA-4, were evaluated in WT and AT1R−/− OT-I cells (CD8+CD45.1+) isolated from the spleen of mice (CD45.2+) infected with OVA-PbA at day 6 p.i. The gating strategy used for the flow cytometry analysis is indicated in the Materials and Methods. (A–C) Representative dot plots, percentage of CTLA-4+ OT-I cells among total OT-I cells in the spleen (*p < 0.0001), and expression of CTLA-4 (*p < 0.0001). (D–F) Representative dot plots, percentage of LAG-3+ OT-I cells among total OT-I cells in the spleen (*p < 0.0001) and expression of LAG-3 (*p = 0.0018). (G–I) Representative dot plots, percentage of PD-1+ OT-I cells among total OT-I cells in the spleen (p = 0.7826), and expression of PD-1 (p = 0.3596). *In relation to WT OT-I cells. Data are means ± SEM of five mice per group and are representative of three independent experiments with similar results for each indicated time point.

