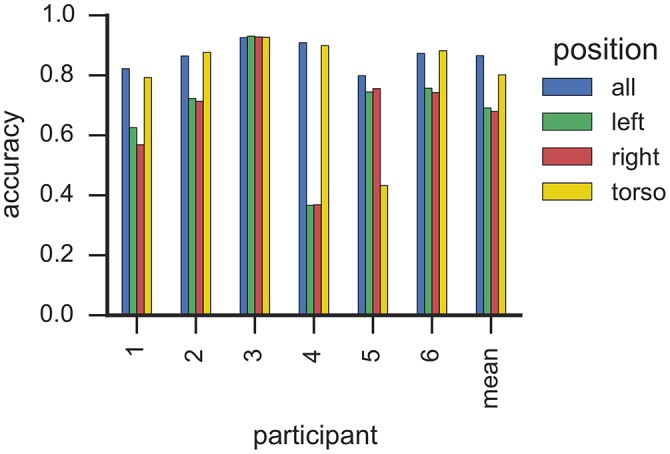
Figure 5.

This plot shows the classification accuracy based on sensor position with RF classifiers. Each bar corresponds to one sensor from one participant. Sensors are grouped by participants, where the right-most group summarizes the average accuracy per sensor. We estimated the accuracy by means of k-fold cross-validation where folds correspond to recording sessions.
