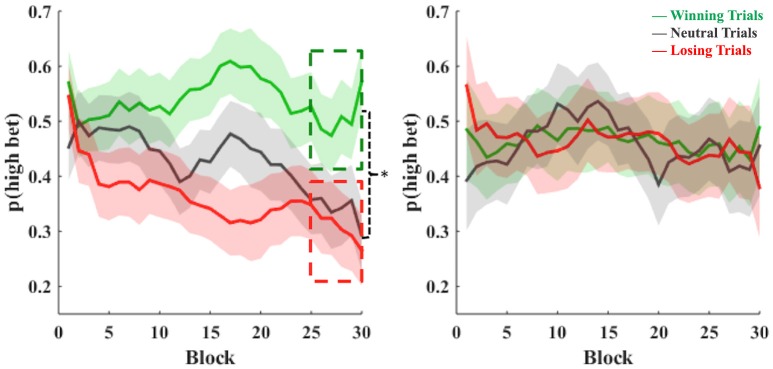
Figure 2.
Differences in choice behavior across blocks for low-impulsive subjects (left) and high-impulsive subjects (right). The vertical axis shows the choice behavior (betting high) for likely winning trials (green), neutral trials (gray), and likely losing trials (red) across the task. Every block represents 20 single trials in our gambling task. Shaded areas indicate SEM for each trace.

