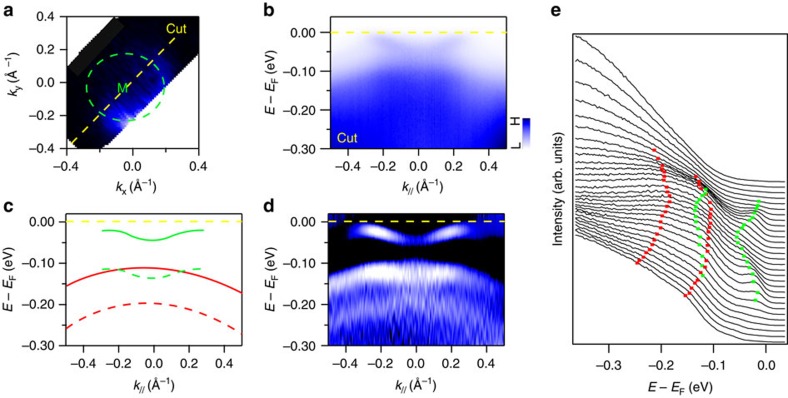
Figure 1. The ARPES spectra of 1UC FeSe grown on STO(110).
(a) The M point Fermi surface map of FeSe/STO(110). The yellow dashed line shows the high-symmetry cut along Γ-M direction. (b) Energy–momentum intensity map of FeSe/STO(110) around the cut marked at a. (c) Schematic representation of the electron band (green) and hole band (red) of FeSe/STO(110). The replica bands are shown as the dashed lines. (d) Second derivative image of (b). Comparison with c identifies the features associated with the main bands and the replica bands. (e) EDCs near M shown as a waterfall plot with main and replica bands marked by corresponding colour squares.

