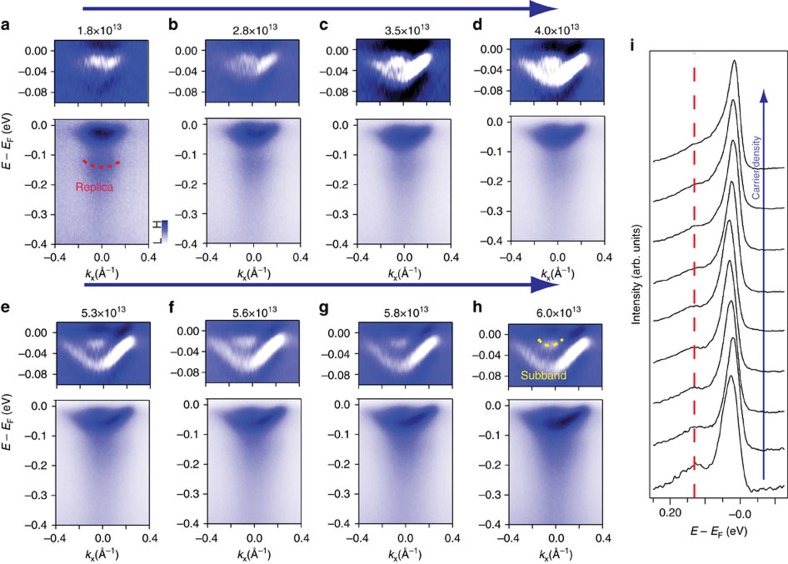
Figure 3. The photodoping evolution of the ARPES spectra for the surface bands of STO(110).
(a–h) The evolution of the ARPES dispersion as the surface carrier density increases from n2D≈1.8 × 10¹³–6.0 × 1013 cm−2. The red curve marks the replica band in a, while the yellow curve marks quantum well subband in h. The upper part of each panel shows the second energy derivative of the lower part in the −100 meV ≤E-EF≤0 energy window. (i) EDCs of the main band and replica band as the carrier increases from n2D≈1.8 × 10¹³–6.0 × 1013 cm−2. The dashed red line marked the positon of replica band.

