Figure 1.
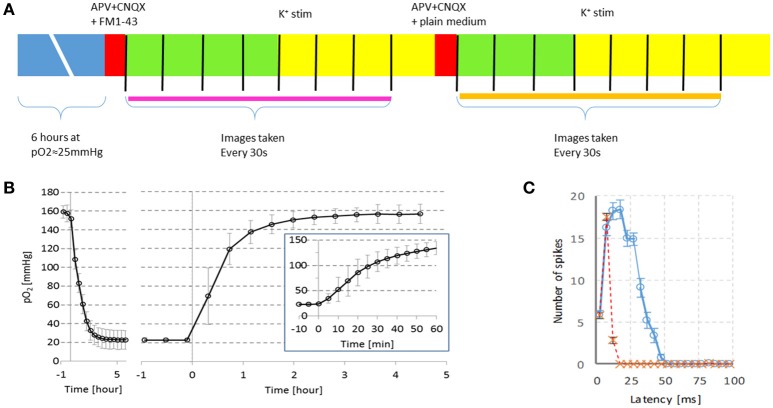
Timeline of the experiments and verification of experimental conditions. (A) Cultures were exposed to 6 h of hypoxia at pO2 ≈20 mmHg. Then, excitatory synaptic transmission was blocked by APV and CNQX and an FM dye was added to the medium. The cultures were installed under the microscope and imaging started (every 30 sec, indicated by vertical black lines). Cultures were stimulated in the 2nd min of imaging by potassium (n = 26) or electrically (n = 2). Electrical stimulation was repeated in the 4th min of imaging. Then the FM dye was washed out, and cultures were stimulated again in the 2nd min after medium change. Endocytosis measurement is indicated by the thick pink line, exocytosis measurement is indicated by the orange line. (B) Partial oxygen pressure (pO2) in culture medium with a cortical culture (mean ± SD of n = 3) following a stepwise change in gas mixture settings at t = 0. Left panel: The gas mixture fed to the hypoxic chamber was changed from normoxia (pO2 ≈160 mmHg) to hypoxia (pO2 ≈20 mmHg) at t = 0. Right panel: At t = 0 the gas mixture returned to normoxia. Before and after the oxygen measurements, electrical activity was recorded from the neurons, confirming that the cells were alive. Inset: pO2 during the 1st h at higher temporal resolution. (C) Example of responses to electrical stimulation before ( , ), or after blockade of glutamatergic synaptic transmission. All recorded action potentials are counted in 5ms bins after each stimulus pulse, mean ± SEM of 10 stimulus pulses are shown. In both cultures the late phase of the stimulus response (latency >15 ms) was completely blocked at the concentrations used.

