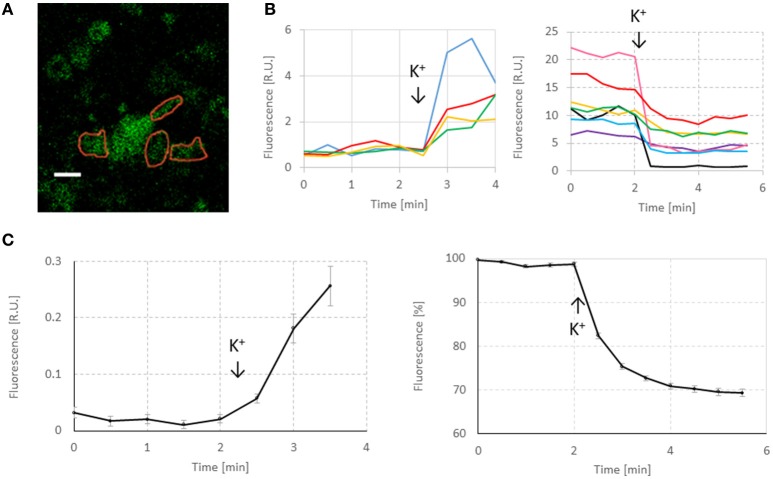
Figure 2.
Representative responses of FM1-43 in neurons. (A) Image taken before exocytosis. Red lines indicate selected ROIs. White scale bar: 10 μm. The imaging resolution is somewhat low, as a consequence of maximizing the scanning area. However, it was sufficient to quantify the effect of hypoxia on endo- and exocytosis and to observe significant differences between normoxia and hypoxia. (B) Representative responses to first potassium stimulation and to second potassium stimulation after washing. First increase in fluorescence was used to quantify endocytosis. The second response (decreased fluorescence) was used to quantify exocytosis. Addition of 60 mM KCl was indicated by arrows and “K+.” (C) Average endocytosis and exocytosis curves under control conditions (n = 258 ROIs in 11 cultures). For endocytosis curves, minimum fluorescence before stimulation was subtracted from all points to facilitate averaging. Exocytosis curves were normalized to their fluorescence at 2 min before stimulation.

