Figure 3.
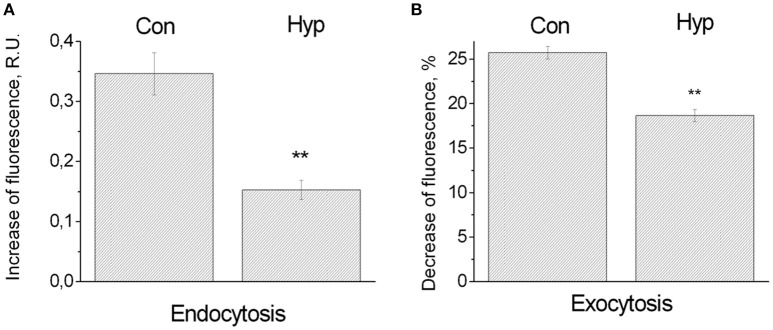
Influence of hypoxia on the synaptic vesicle cycle. (A) Endocytosis. Bars indicate increasing fluorescence upon a series of stimulation induced action potentials, in random units (R.U.), under normoxic conditions (258 ROIs in 11 cultures: Con), or hypoxic conditions (101 ROIs in 8 cultures: Hyp). Error bars indicate SEM, and reflect differences between ROIs. (B) Exocytosis. After loading, extracellular dye was washed out to measure the decreasing fluorescence upon a series of action potentials in response to stimulation. Decreasing fluoresce was normalized to the average fluorescence after dye loading. Error bars indicate SEM and reflect differences between 526 ROIs of 14 cultures (control conditions: Con), or 452 ROIs in 12 cultures (hypoxic conditions: Hyp). **Indicate significant differences (p < 0.01).

