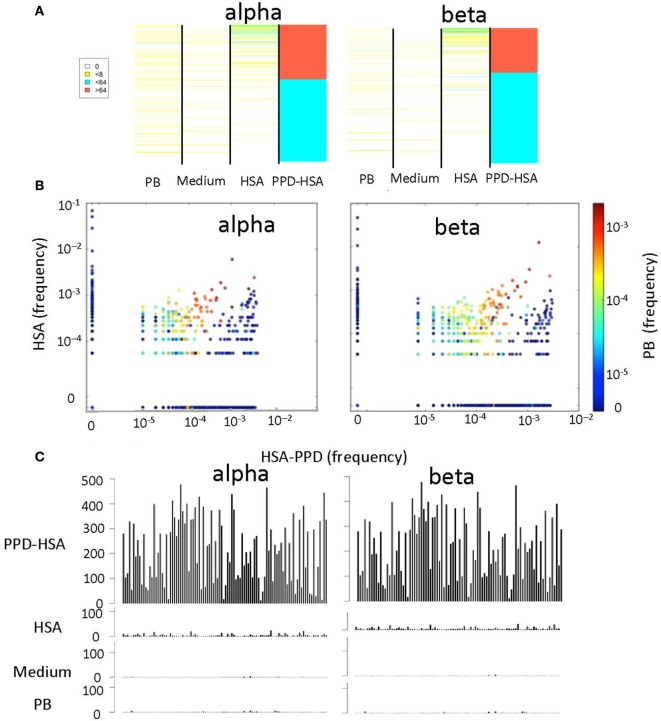
Figure 4.
The relative T cell receptor (TCR) abundances in different in vitro cultures. (A) Heat map showing the abundance of each TCR with a stimulation index (SI) > 8 in paraphenylenediamine (PPD)–human serum albumin (HSA) cultures, in cultures with medium alone, HSA, or in the ex vivo (PB) sample. Each row of the heat map is a distinct TCR gene sequence, colored according to its abundance. The TCRs are ranked in order of their abundance in the PPD–HSA cultures. (B) The relative frequency of TCR in PPD–HSA (x axis) cultures versus HSA alone (y axis). Each dot represents a distinct TCR, and the color represents frequency in the PB sample. (C) Histograms of the abundances in all four repertoires of all TCRs with an SI > 8 in PPD–HSA cultures and an SI > 1 in HSA cultures.

