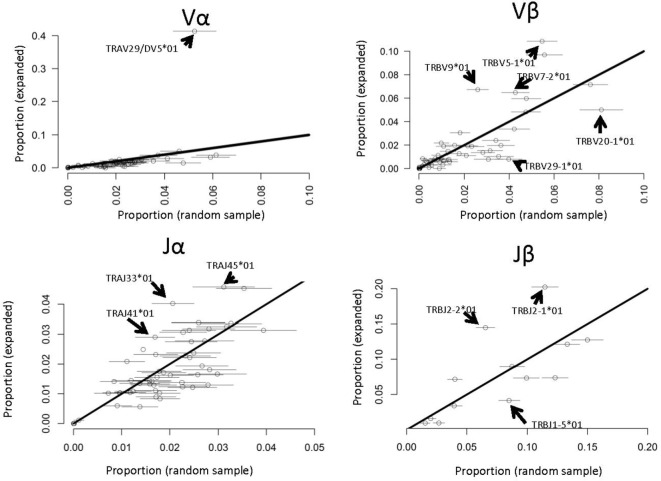
Figure 6.
V and J gene usage in paraphenylenediamine–human serum albumin expanded T cell receptors (TCRs) compared to random TCRs. For each V or J gene, the abundance in the expanded TCR set illustrated in Figure 4A is shown along the y axis, and the abundance (mean plus 2 SDs) in 100 equal-sized random samples of TCRs drawn from the ex vivo repertoires is shown along the x axis. The full names of those genes, which differ significantly from the diagonal (i.e., are over- or underrepresented in the expanded set) are shown.

