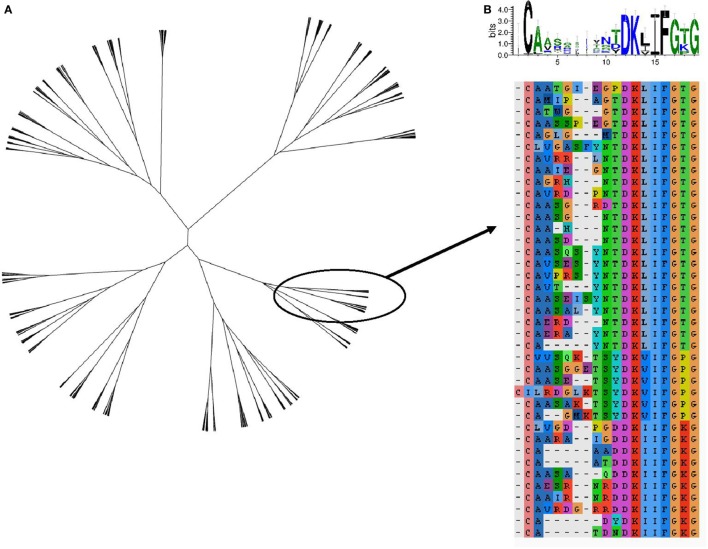
Figure 7.
The sequence relationship between the complementarity-determining region (CDR3)β sequences of the T cell receptors (TCRs), which are expanded [stimulation index (SI) > 3] after culture in the presence of paraphenylenediamine–human serum albumin. (A) Unrooted tree of all expanded TCRβ CDR3 clustered according to Levenshtein distances (Ward agglomerative clustering). (B) Multiple sequence alignment and sequence logo of the subtree of (A) containing the most expanded CDR3β sequence.

