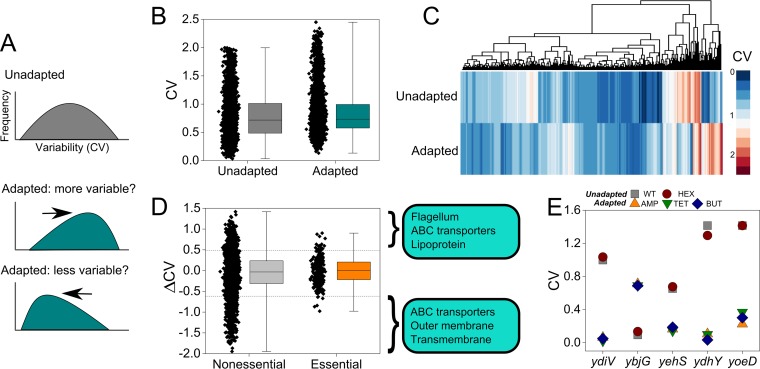
FIG 3 .
Shifts in gene expression variability are present during bacterial adaptation. (A) Hypothetical distribution in interpopulation gene expression variability. If unadapted samples possess a certain distribution, we predict that shifts in variability will occur in adapted populations. (B) Distribution of variability (CV in FPKM) in gene expression across 4,181 genes in unadapted and adapted samples. For box plots in panels B and D, all data points are shown for each condition. Box plots display the interquartile range and median for the corresponding data. Whiskers on box plots show the minimum and maximum values. (C) Hierarchical clustering by gene expression variability reveals clusters of genes (on vertical axis) with higher and lower variability in unadapted versus adapted bacterial populations. (D) Shifts in gene expression variability in nonessential and essential genes. Shifts are defined as ΔCV = CVunadapted − CVadapted. For ΔCV < 0, the gene has higher expression variability in adapted populations. For ΔCV > 0, the gene has lower variability in adapted populations. The three most enriched gene ontologies are displayed for the 10% of genes with highest and lowest ΔCV (10th and 90th percentiles in ΔCV for all genes are marked with horizontal dashed lines). (E) CV across duplicates for five genes with significantly different expression variability in adapted versus unadapted populations. Abbreviations are as in Fig. 1.

