FIG 1.
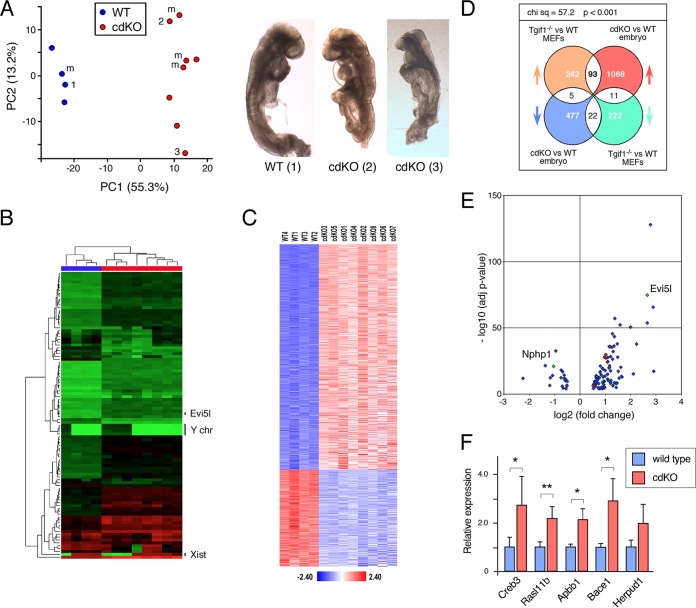
Transcriptome analysis of cdKO embryos. RNA was isolated from four wild-type and eight cdKO embryos and analyzed by RNA-seq. (A) Principal-component analysis of the RNA-seq data. The three numbered points correspond to the three numbered embryos shown on the right. m, male embryos as determined by analysis of the RNA-seq data. (B) Unsupervised hierarchical clustering of the RNA-seq data, based on the 100 most variable genes. The positions of Xist and a small cluster of male-specific genes from the Y chromosome (chr) are shown, as is the position of Evi5l. (C) RNA-seq data were filtered using a log fold change of ±0.5 and an adjusted P value cutoff of <0.0001 and are displayed as the Z-scores for the 1,676 genes that passed this cutoff when comparing the wild type to the cdKO. (D) Analysis of the overlap between the data and Affyemtrix expression array data from wild-type and Tgif1-null primary MEFs. The distributions of the genes in the four overlapping segments were compared by chi-square analysis using a 2-by-2 contingency table. (E) Volcano plot for the P value versus the fold change for the 93 and 22 genes that increase or decrease, respectively, in both analyses shown in panel D. The red dots are genes tested for panel F, and Nphp1 and Evi5l are indicated. (F) Four wild-type and four cdKO embryos were analyzed by qRT-PCR for a selection of the genes in the overlap between the embryo RNA-seq and the MEF expression analysis. Relative expression compared to the wild type is shown. *, P < 0.05; **, P < 0.01. The error bars indicate standard deviations (SD).

