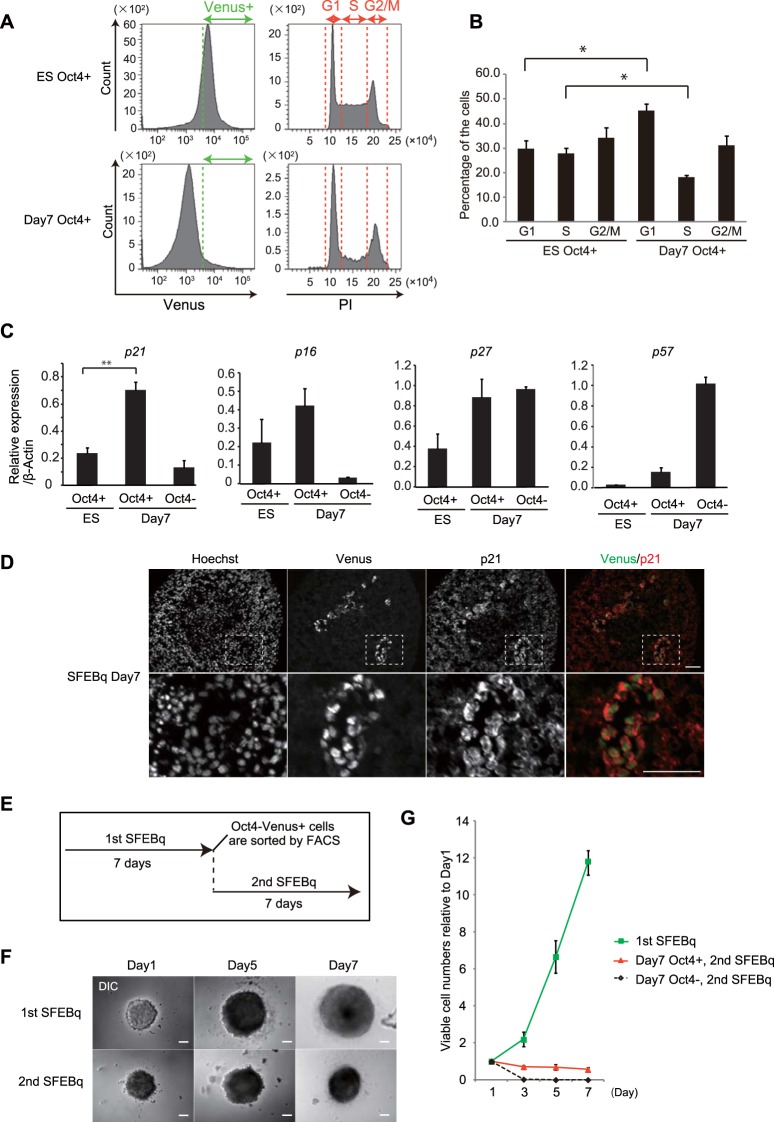
FIG 3.
Day 7 Oct4+ cells arrest their cell cycle progression. (A) FACS analysis for the cell cycle profiles of undifferentiated Oct4-Venus mESCs (ES Oct4+) and SFEBq-cultured cells on day 7 (day 7 Oct4+). DNA contents were analyzed by PI staining (right) in the Venus+ cell fraction (left). (B) Quantification of the cell cycle profiles shown in panel A. Data represent the mean ± SEM (n = 3). *, P < 0.05, analyzed by the Bonferroni multiple-comparison test. (C) RT-qPCR analysis for the expression of CDK inhibitors in FACS-isolated undifferentiated Oct4-Venus mESCs (ES, Oct4+), SFEBq-cultured day 7 Oct4+ cells (day 7, Oct4+), and SFEBq-cultured day 7 Oct4− cells (day 7, Oct4−). Data represent the mean ± SEM (n = 3). **, P < 0.01, analyzed by t test. (D) Images of Oct4-Venus, p21, and Hoechst in cryosections of SFEBq-cultured Oct4-Venus mESCs on day 7. Magnified images of the boxed areas in the top panels are shown in the bottom panels. Bars = 50 μm. (E) Experimental schemes for SFEBq reculture assay. (F) Phase-contrast images of cell spheres in the first and second SFEBq cultures on days 1, 3, and 7. DIC, differential inference contrast. Bars = 100 μm. (G) Proliferation curve of cells during primary and secondary SFEBq culture of FACS-isolated undifferentiated Oct4-Venus mESCs (1st SFEBq), SFEBq-cultured day 7 Oct4+ cells (day 7 Oct4+, 2nd SFEBq), and SFEBq-cultured day 7 Oct4− cells (day 7 Oct4−, 2nd SFEBq). Data represent the mean ± SEM (n = 3).

