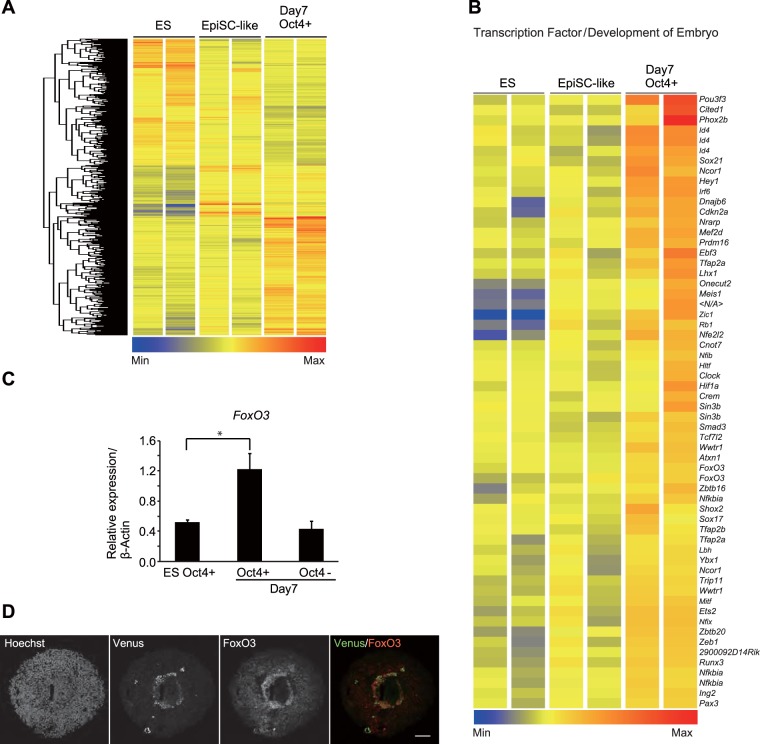
FIG 5.
Expression of FoxO3 is upregulated in day 7 Oct4+ cells. (A) Unsupervised hierarchical clustering and heat map display of genes differentially expressed (greater than or less than 1.4-fold) in FACS-isolated SFEBq day 7 Oct4+ cells compared with their expression in undifferentiated mESCs (ES) and EpiSC-like cells. (B) Heat map display of transcription factors involved in embryonic development. Transcription factors upregulated in SFEBq day 7 Oct4+ cells (>1.4-fold) are shown. Min, minimum; Max, maximum. (C) RT-qPCR analysis for the expression of FoxO3 in FACS-isolated undifferentiated Oct4-Venus mESCs (ES Oct4+), SFEBq-cultured day 7 Oct4+ cells (day 7, Oct4+), and SFEBq-cultured day 7 Oct4− cells (day 7, Oct4−). Data represent the mean ± SEM (n = 3). *, P < 0.05, analyzed by t test. (D) Images of Oct4-Venus (green), FoxO3 (red), and Hoechst (blue) in cryosections of cell spheres of SFEBq cultures on day 7. Bar = 75 μm.

