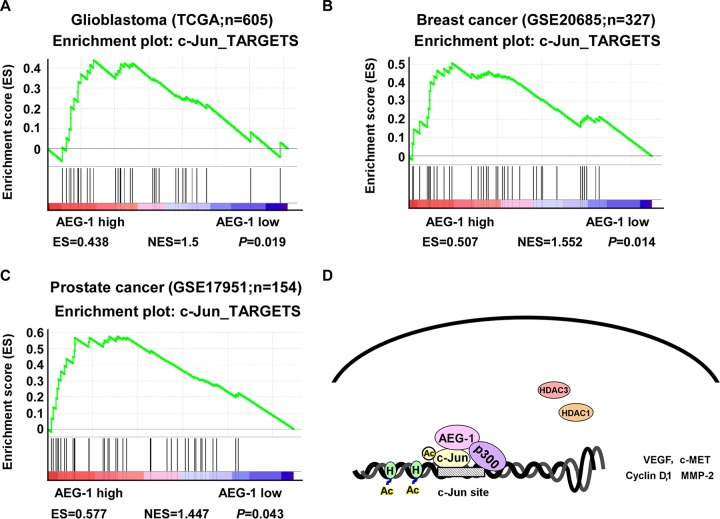
FIG 7.
Relationship between the AEG-1 expression signatures and the c-Jun-activated gene signatures, as analyzed by GSEA. (A) GSEA plots of the AEG-1 expression signatures and the c-Jun-activated gene signatures of glioblastoma patients, obtained from the TCGA database (n = 605). (B) GSEA plots of the AEG-1 expression signatures and the c-Jun-activated gene signatures observed in breast cancer data sets (Gene Expression Omnibus database accession number GSE20685; n = 327). (C) GSEA plots of the AEG-1 expression signatures and the c-Jun-activated gene signatures observed in prostate cancer data sets (Gene Expression Omnibus database accession number GSE17951; n = 154). (D) Schematic model of AEG-1-dependent acetylation and activation of c-Jun in a glioma.

