Figure 7.
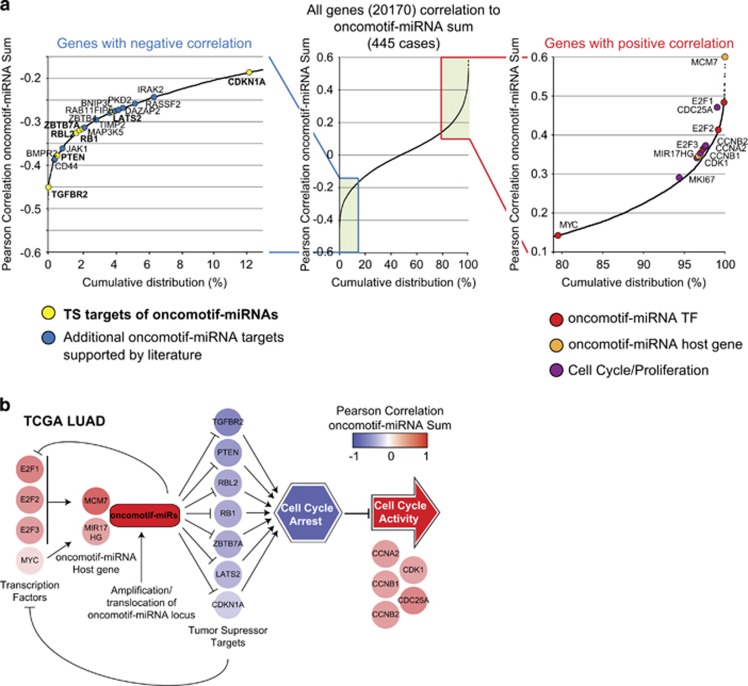
Oncomotif-miRNA signaling in LUAD. (a) Middle plot shows the cumulative distribution of correlations between oncomotif-miRNA expression and the mRNA expression of 20 170 genes in LUAD (TCGA LUAD). On the left side is a zoom in on the genes with a negative correlation to oncomotif-miRNA expression. Indicated in the plot are previously validated targets of different oncomotif-miRNAs (yellow are TS targets discussed here and blue are additional targets with literature support). On the right side is a zoom in on genes with a positive correlation to oncomotif-miRNA expression. Indicated in the plot are known oncomotif-miRNA transcription factors, oncomotif-miRNA host genes and cell cycle/proliferation-related genes. (b) Oncomotif-miRNA signaling network in LUAD. Individual genes are color-coded based on correlation to oncomotif-miRNA expression in TCGA LUAD. Activating E2F transcription factors (E2F1-3) and MYC drives expression of oncomotif-miRNAs through transactivation of known miRNA host genes MCM7 (hsa-mir-93 and hsa-mir-106b) and MIR17HG (hsa-mir-17 and hsa-mir-20a). Sporadic high expression from additional oncomotif-miRNA loci through, e.g., amplification/translocation contributes to the total expression of oncomotif-miRNAs. Oncomotif-miRNA-dependent inhibition of common TS targets results in a relieved cell cycle arrest and progression through the cell cycle as indicated by cell cycle-related genes. Oncomotif-miRNA expression also form a self-propagating feed-forward loop as several of the TS targets are also inhibitors of the transcription factors responsible for oncomotif-miRNA expression. See also main text for extensive discussion.

