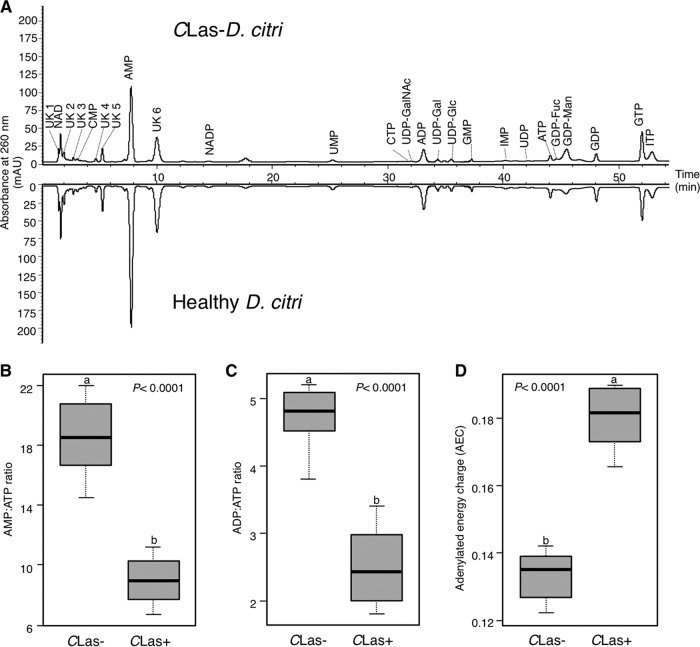
FIG 2.
Mirror high-performance anion-exchange chromatograms of nucleotides and sugar nucleotides detected in healthy (CLas−) and CLas-infected (CLas+) Diaphorina citri adults. (B to D) AMP/ATP ratios (B), ADP/ATP ratios (C), and adenylated energy charge (AEC) values (D) in healthy and CLas-infected Diaphorina citri adults. For panels B to D, horizontal thick lines indicate the medians, boxes show the interquartile ranges including 25 to 75% of the values, and whiskers show the highest and the lowest values in each set. Letters on the bars indicate significant differences (P ≤ 0.05).

