FIG 7.

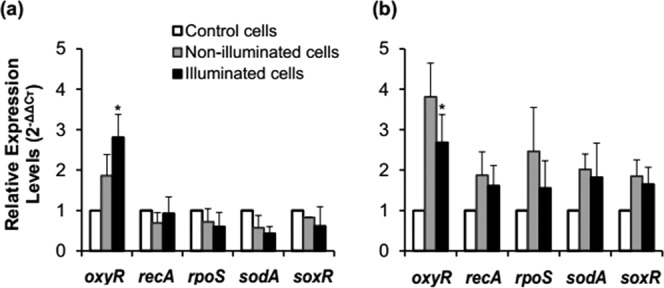
Relative expression levels of oxyR, recA, rpoS, sodA, and soxR in nonilluminated and LED-illuminated cells of S. Enteritidis (a) and S. Saintpaul (b) at a set temperature of 4°C at 72 J/cm2. *, P ≤ 0.05 versus nonilluminated cells.

Relative expression levels of oxyR, recA, rpoS, sodA, and soxR in nonilluminated and LED-illuminated cells of S. Enteritidis (a) and S. Saintpaul (b) at a set temperature of 4°C at 72 J/cm2. *, P ≤ 0.05 versus nonilluminated cells.