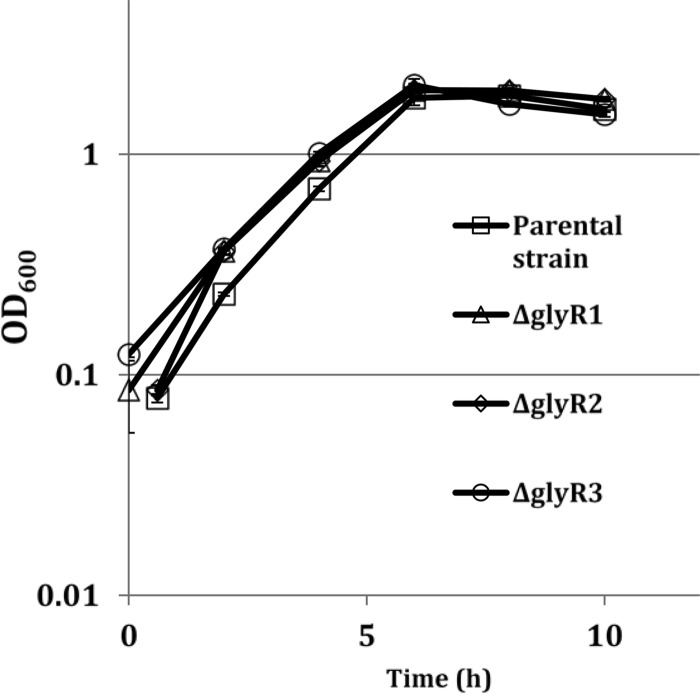
FIG 1.
Growth of the parental and mutant strains on 5 g · liter−1 cellobiose in 1-liter bioreactors for RNA-Seq analysis. Plotted are average OD600 values from triplicate fermentations with error bars (within symbols and shown as standard deviations). Transcriptomics samples were taken at mid-log phase (OD600, 0.7 to 0.95), late log phase (OD600, 1.8 to 2.0), and in stationary phase approximately 30 min after cultures stopped producing acid (OD600, 2.0 to 2.2).

