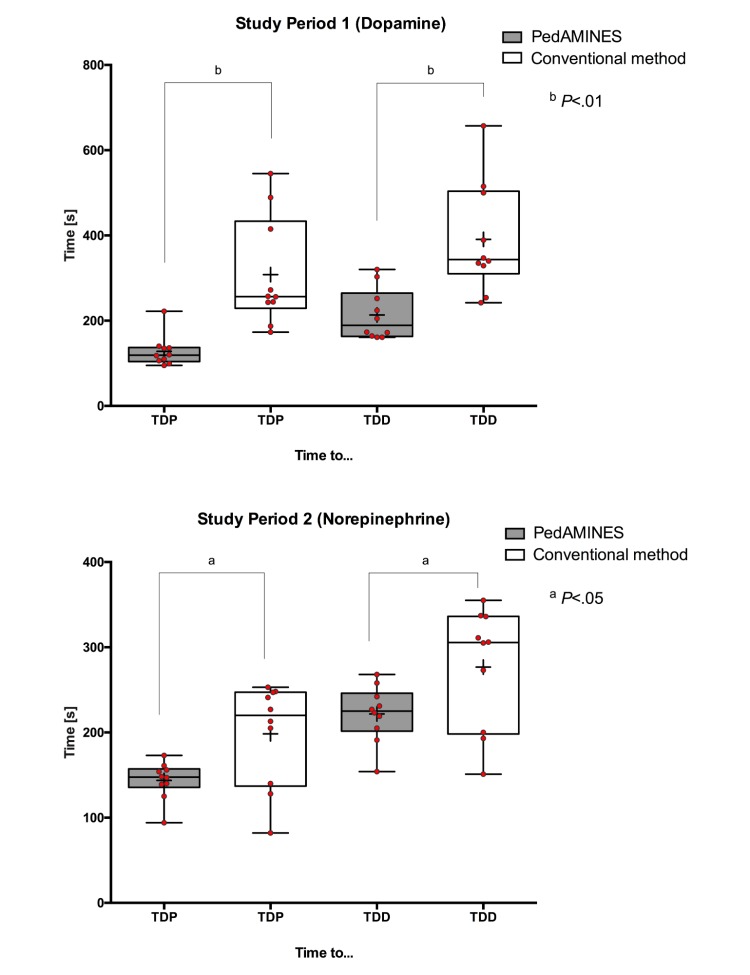
Figure 4.
Study period 1 (Dopamine) and 2 (Norepinephrine). Boxplots of elapsed time to drug preparation (TDP) and to drug delivery (TDD) in intervention group (PedAMINES) and control group (conventional method). Solid horizontal lines denote median and interquartile ranges; the whiskers go down to the smallest value and up to the largest; + denotes mean. Red open circles denote each individual value. Time is expressed in seconds.

