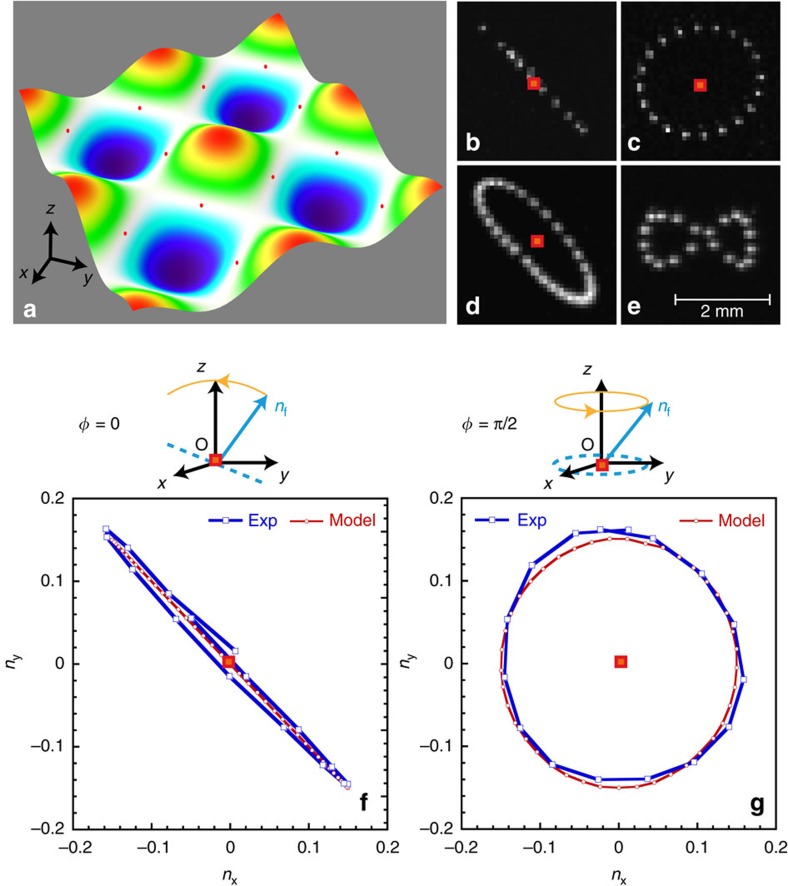
Figure 2. Surface elevation and surface particle orbits near the nodal points.
(a) Measured surface elevation produced by two orthogonal standing waves. Red dots indicate positions of nodal points. (b–d) Orbits of the surface particles near the nodal points (red squares) for different phase shifts φ between the standing waves: (b) φ=0, (c) φ=π/2 and (d) φ=π/4. The orbital motion is measured over one wave period T=2π/ω≈0.26 s. (e) A particle orbit near a nodal point for ω1=2ω2. (f,g) Temporal trace (over T) of the horizontal projections (nx, ny) of the water surface normals (nf in the schematics) at a nodal point for f φ=0 and g φ=π/2. Experimental measurements are compared with the theoretical model (see ‘Methods' section) for ω1=ω2, f=ω/2π=3.9 Hz (λ=104 mm) and H=1 mm.

