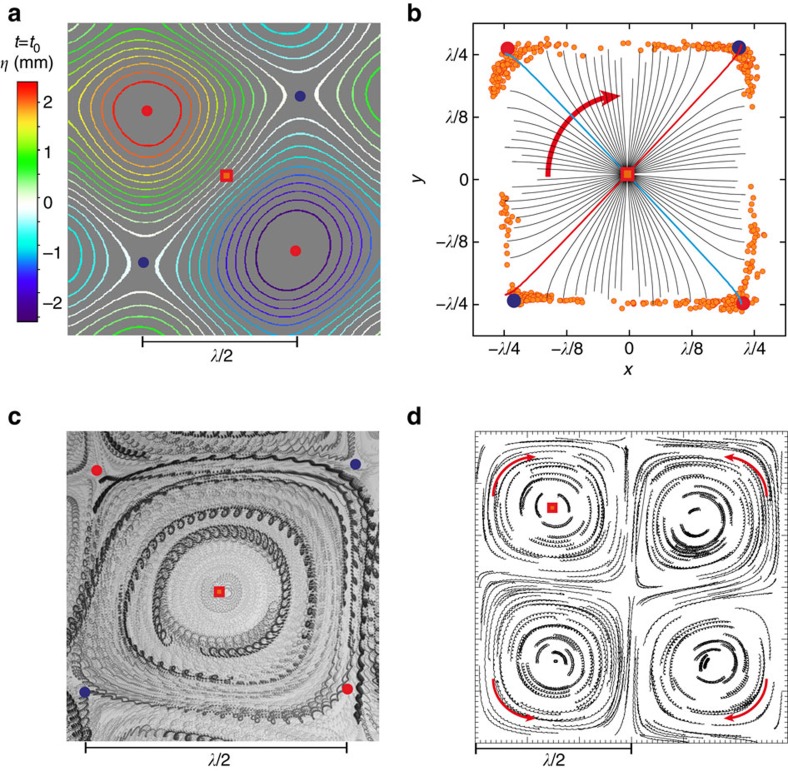
Figure 3. Surface topography and fluid particle trajectories at the surface for φ=π/2.
(a) Contour plot of the surface elevation η measured at the half-wavelength scale and t=t0. The positions of a nodal point (red square), peaks/troughs (red circles) and saddle points (blue circles) are highlighted. (b) Dynamics of the rotating wave about a nodal point within a unit cell of size Lc=λ/2. Orange circles: motion of wave peaks experimentally tracked for 50T. Black lines: the rotation of the z=0 isoline of the surface elevation followed for T/2. (The red line indicates t=t0, the blue one t=t0+T/4.) (c,d) Surface particle drifts tracked for ≈50T: (c) within a single unit cell, particle orbits drift forming closed nested guiding centre trajectories (experiments, f=ω/2π=3.9 Hz (λ=104 mm), H=2.5 mm). (d) The direction of the drift alternates in adjacent unit cells (experiments, PTV measurements, f=3.9 Hz, H=1 mm).

