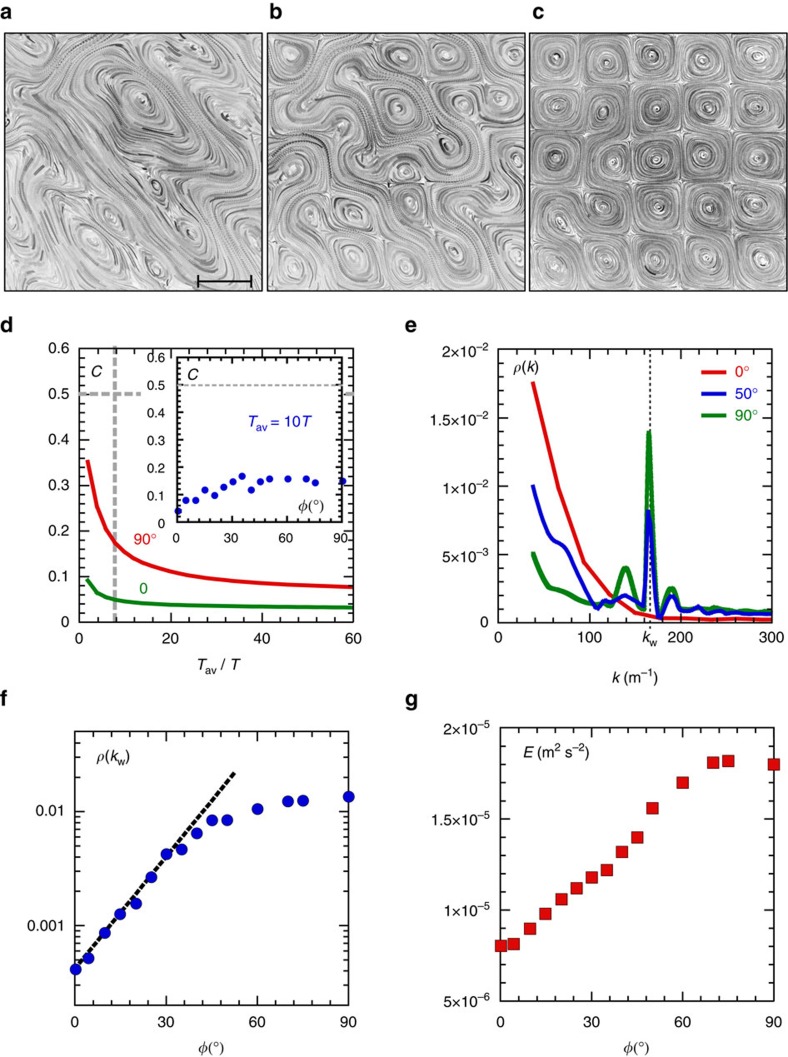
Figure 5. Liquid-interface metamaterial.
(a–c) Surface particle streaks measured at different phases φ: (a) φ=0, (b) φ=50°, (c) φ=90° (experiments, f=ω/2π=4.58 Hz, λ=78 mm, H=2 mm, 5 × 5 unit cells shown out of the 8 × 8 lattice formed in the cavity; Scalebar, 39 mm.). (d) Compressibility C of the horizontal flow, equation (2), measured at φ=0 (green) and at φ=90° (red) versus averaging time Tav normalized by the wave period T. Inset: C averaged over 10 wave periods is small, C<0.2 in the range of φ=(0−90)°. (e) Wave number spectrum of the structure function ρ(k) for different relative phases φ. As φ approaches π/2, the flow develops spatial order, indicated by a peak at kw corresponding to λ/2. (f) The onset of the spatially ordered flow is seen as an exponential growth of ρ(kw) with φ in the range of φ=(0−40)°. (g) The mean horizontal kinetic energy E of the surface flow increases with φ by a factor of >2.

