
FIGURE 4.
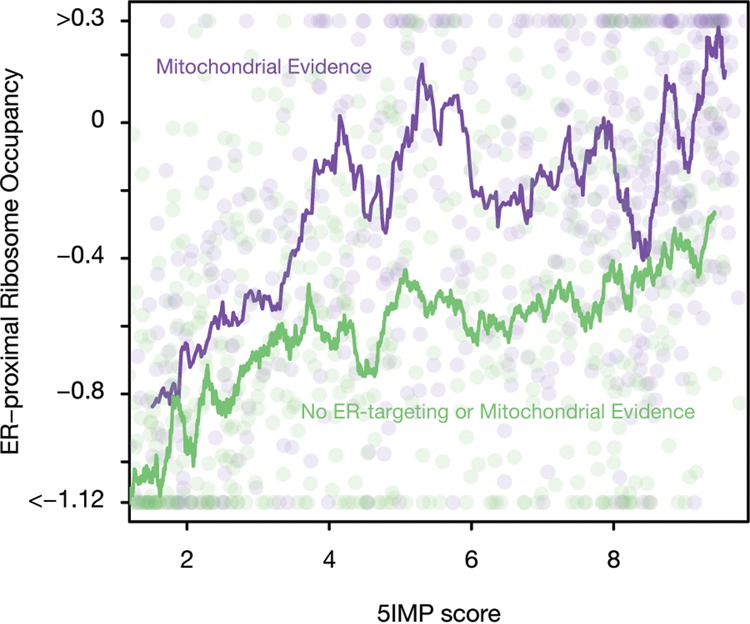
5IM transcripts are more likely to exhibit ER-proximal ribosome occupancy, even where there is no evidence of ER-targeting. A moving average of ER-proximal ribosome occupancy was calculated by grouping genes by 5IMP score (see Materials and Methods). We plotted the moving average of 5IMP scores for transcripts with no evidence of ER- or mitochondrial targeting (green) or for transcripts predicted to be mitochondrial (purple). We plotted a random subsample of transcripts on top of the moving average (circles).