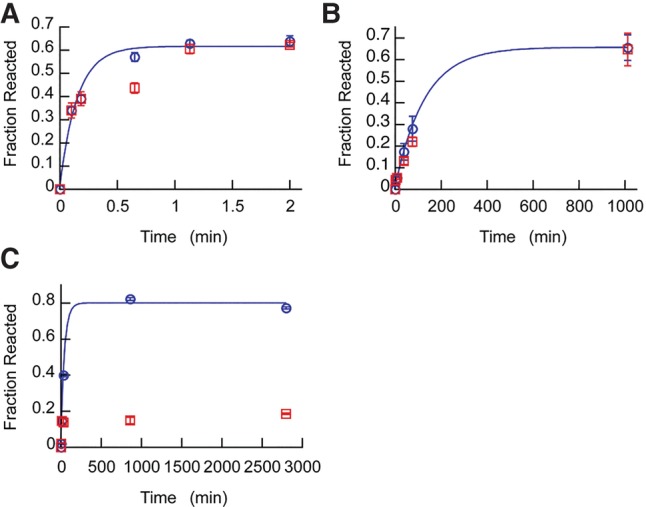
FIGURE 9.

Chelation of Ca2+ by EGTA halts glmSCa, but not glmSWT or glmSAAA under physiological cation concentrations. Reaction time courses for (A) glmSWT (in the presence of 25 µM GlcN6P), (B) glmSAAA, and (C) glmSCa were initiated by the addition of both 25 mM Mg2+ and 25 mM Ca2+. After the second time point, half of the sample from each reaction was transferred into a fresh tube containing a twofold molar excess of EGTA. The reactions with (red) or without EGTA (blue) added were continued for the remaining time points. First-order rate fits are shown for reactions with no EGTA added (blue). Error bars are standard errors of the mean from three independent time courses.
