
Fig. 2.
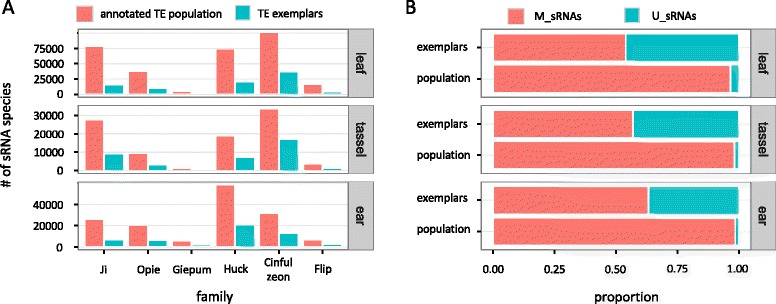
sRNA metrics on TE exemplars and annotated TE populations. a Total number of sRNA species that mapped to each family. b Proportion of U_sRNA and M_sRNA species for all families combined
Official websites use .gov
A
.gov website belongs to an official
government organization in the United States.
Secure .gov websites use HTTPS
A lock (
) or https:// means you've safely
connected to the .gov website. Share sensitive
information only on official, secure websites.
sRNA metrics on TE exemplars and annotated TE populations. a Total number of sRNA species that mapped to each family. b Proportion of U_sRNA and M_sRNA species for all families combined