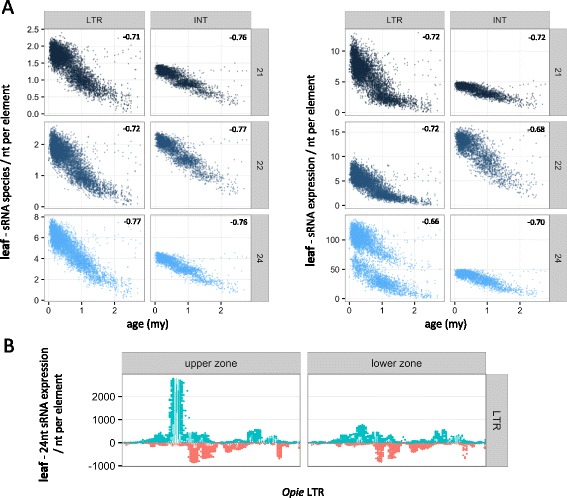
Fig. 6.

Opie population split based on sRNA expression data from leaf tissue. a Relationship between TE age and number of sRNA species (left) or expression (right) calculated per nucleotide of the Opie LTRs and INT domain. Age is cutoff at 3my to allow sufficient visualization of the x-axis. The Spearman r coefficient is shown for each plot, calculated for all elements and not only for those <3my. b Mapping patterns (calculated as in Fig. 3a) of 24 nt expression data along the LTRs of the two distinct Opie subpopulations. sRNA data in A and B were not weighted by their number of genomic loci
