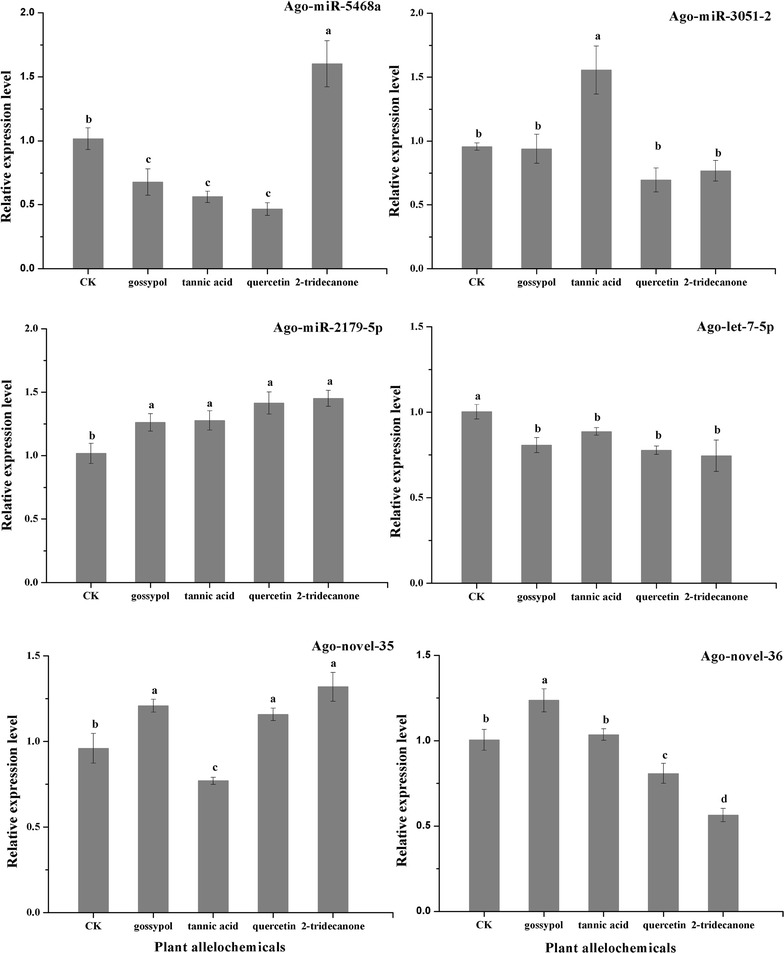
Fig. 4.

Differential expressions of miRNAs following plant allelochemical treatment. The results are presented as mean ± SD for three independent replicates. Different letters on the bars of the histogram indicate significant differences based on ANOVA followed by Tukey’s HSD multiple comparison test (P < 0.05)
