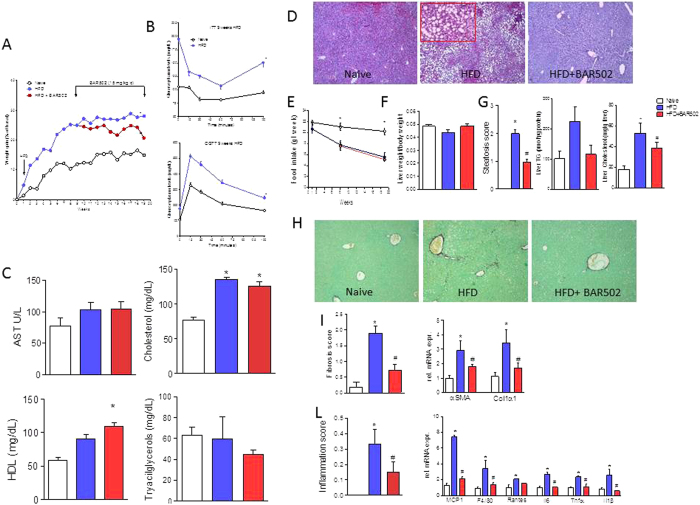
Figure 1. BAR502 reduced body weight gain and reduced hepatic lipid partition in mice fed HFD.
Mice were fed a HFD and fructose for 18 weeks. BAR502 was administered at the dose of 15 mg/kg/day starting on day 63 (week 9). The data shown are (A) body weight (% delta weight); (B) glycemic response to oral glucose tolerance test (OGTT) and to insulin-tolerance test (ITT) (both after 9 weeks of HFD). (C) plasma levels of AST, cholesterol, HDL and triacylglycerols measured at the end of the study. The data shown in Panels (A–C), are mean ± SE of 9 mice. (D) Hematoxylin and eosin (H&E) staining on mice liver tissues showing severe steatosis and ballooning of hepatocytes in mice feed a HFD for 19 weeks. These changes were significantly attenuated by treating the HFD mice with BAR502. The data are mean ± SE of 9 mice. (E) Food intake through the study expressed as mg/week/mouse. The data shown in Panels A–C, are mean ± SE of 9 mice. The data show that while HFD mice had reduced food intake in comparison to mice on standard chow diet, BAR502 did not reduced food intake. Panels F–L. Impact of BAR502 on (F) liver weight, (G) steatosis (Steatosis score) and liver TG and Cholesterol content. (H) Sirius red staining of liver sections; (I) fibrosis score and hepatic expression of αSMA and COL1α1 mRNA; (L) inflammation score and hepatic expression of pro-inflammatory genes. F4/80 is a markers for macrophages. Results are the mean ± SE of 5–9 mice per group. *p < 0.05 versus naive mice, #p < 0.05 versus HFD mice. Values are normalized to B2M and ACTβ, the relative mRNA expression is expressed as 2(−ΔΔCt).

