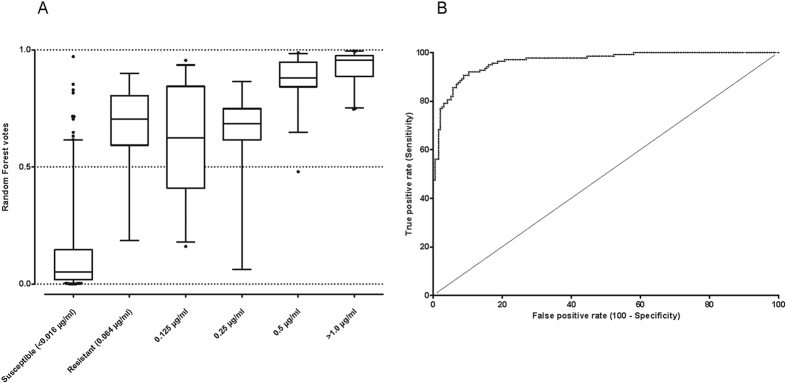
Figure 5.
(A) A box whisker plot of the random forest votes for the levels of resistance to penicillin. Increase in resistance (MIC >= 0.06 µg/ml), as measured by relative increase in the MIC per isolate, is coupled with increased accumulation of the resistance-conferring SNPs that in turn uplift the votes. (B) A Receiver Operating Characteristic (ROC) curve showing the discrimination power of this random forest model in predicting penicillin resistance (Area Under Curve; AUC min = 0.9417 and max = 0.9882 at 99.9% CI).

