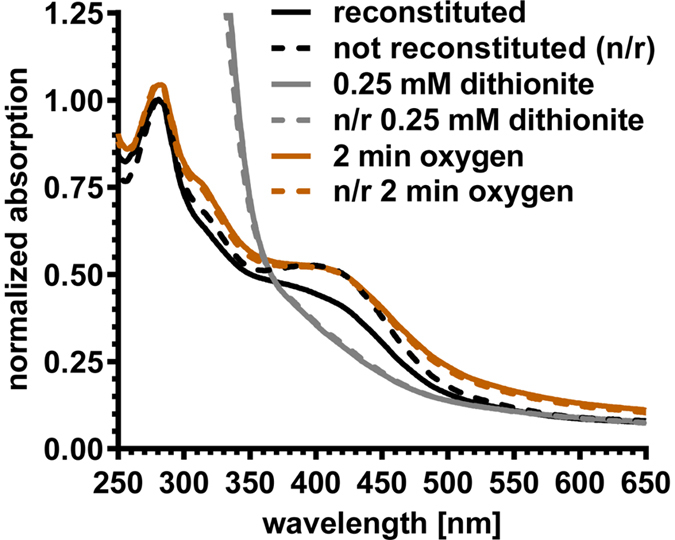
Figure 5. UV-VIS spectra of the [Fe-S] cluster containing activating enzyme.

Reconstituted (solid lines) and non-reconstituted (broken lines) samples of the activating enzyme exhibited identical spectra in the completely dithionite reduced forms (grey), as well as in the re-oxidized form after exposure to ambient oxygen (orange). The reconstituted sample (black solid line) differs from the as prepared sample (broken black line) due to partial reduction with DTT. The spectra were normalized to the absorbance at 280 nm of the reconstituted and non-reconstituted as prepared samples (black lines).
