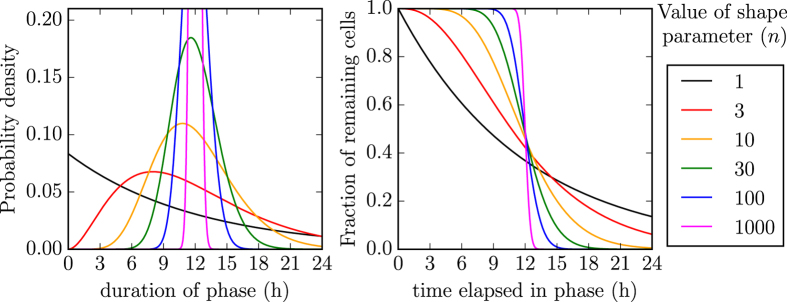
Figure 1. Effect of the Erlang distribution’s shape parameter.
The Erlang distribution is used herein to describe the cell-to-cell variability in the time spent by SHIV-infected cells in the eclipse and virus-producing phases. As the Erlang shape parameter (nE or nI in MM (1), for the eclipse and virus-producing phases, respectively) is increased, the distribution of the phase duration shifts from an exponential (n = 1), to a fat-tailed ( ), to a normal (
 ), to a Dirac delta (
 ) distribution. In these graphs, the mean time spent by cells in the phase (τE or τI in MM (1), respectively) is fixed (set to 12 h, chosen arbitrarily) as the shape parameter (nE or nI) is varied. (Left) Probability density (y-axis) that a cell spend x hours in the (eclipse or infectious) phase. (Right) Fraction of cells (y-axis) which will remain in the phase for at least x hours.

