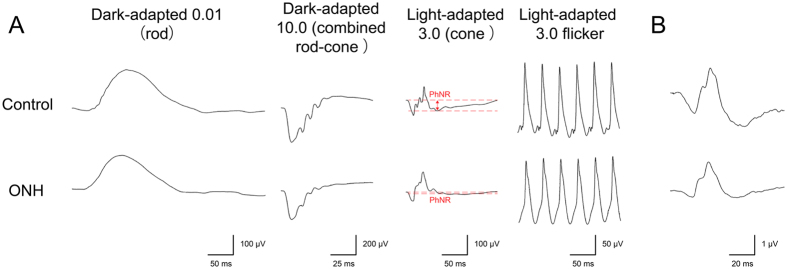
Figure 3. Representative electroretinography (ERG) data from a control eye and an eye with optic nerve hypoplasia (ONH).
(A) A full-field ERG in an eye with ONH shows normal amplitudes and implicit times in almost all components. Only the amplitude of the photopic negative response (PhNR) is decreased in an eye with ONH (red dash lines and arrow). (B) A focal macular ERG in an eye with ONH shows decreased amplitudes but preserved implicit times in all components of the a-wave, b-wave, and PhNR. ms = milliseconds.

