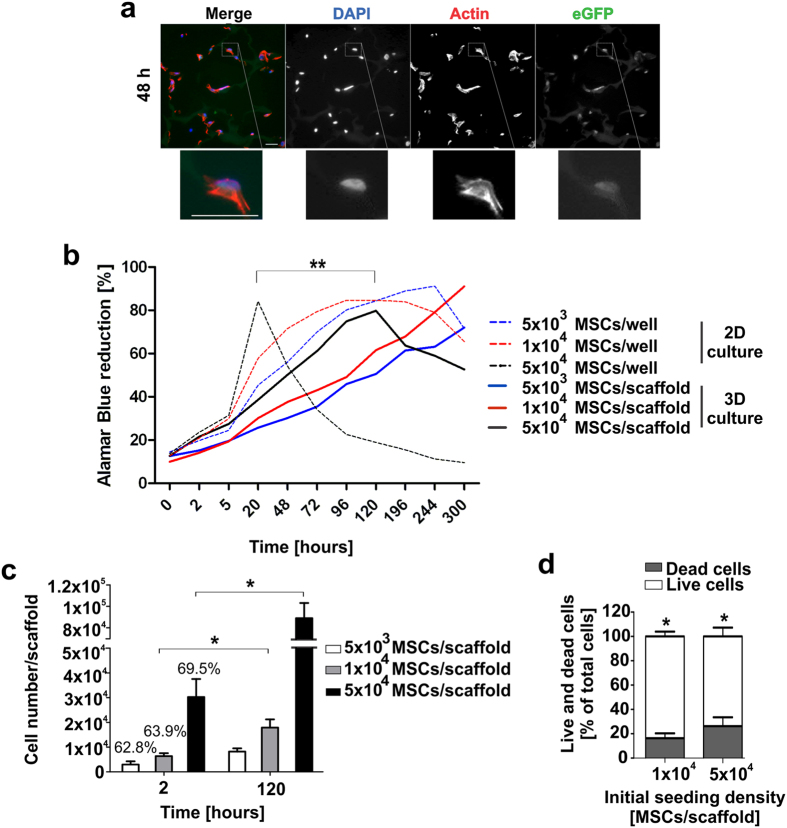
Figure 3. Analysis of cell-supporting properties of the starPEG-heparin cryogel.
(a) Fluorescence microscopy images of 48 h-cultured MSCs in the cryogel scaffold seeded at initial cell number of 5 × 10⁴. Sections were counterstained with DAPI (blue) to detect nuclei, with Alexa fluor647 Phalloidin (red) for actin filaments, and visualized for eGFP expression cassette (green). Zoomed-in images of the inset show a bsAb-releasing MSC adhered to the components of the starPEG-heparin matrix. Scale bars, 30 μm. (b) Metabolically active gene-modified MSCs seeded in 96-well plates in cryogel scaffolds (3D) and in 2D in parallel were analyzed via Alamar blue assay. The proliferative cell activity is expressed as the percentage of Alamar blue reduction over time for each initial cell number used. Dashed lines correspond to MSCs seeded in 2D. Data are shown as the means of three independent experiments performed in triplicates. (c) Total cell numbers of bsAb-releasing MSCs on cryogel scaffolds was calculated 2 h and 120 h after initial cell seeding by measuring the optical density of Alamar blue reduced by the cryogel-housed MSCs at reported time points. The absorbance measured in 2D assays with equivalent number of cells was used as reference value for total available cells to determine the efficiency of initial cell seeding. By setting the seeding efficiency of 2D-seeded MSCs to 100%, relative percentages corresponding to 3D samples were calculated accordingly and are reported above 2 h columns. Data are shown as the means ± SD of three independent experiments. (d) Fractions of live (TUNEL-) and dead (TUNEL+) MSCs detected after 10 days of cultivation in the scaffolds are reported for two different initial cell numbers. Data show the means ± SD of three independent experiments performed in triplicates. Statistical significance was determined using Student’s t-test. *p < 0.05; **p < 0.01.

