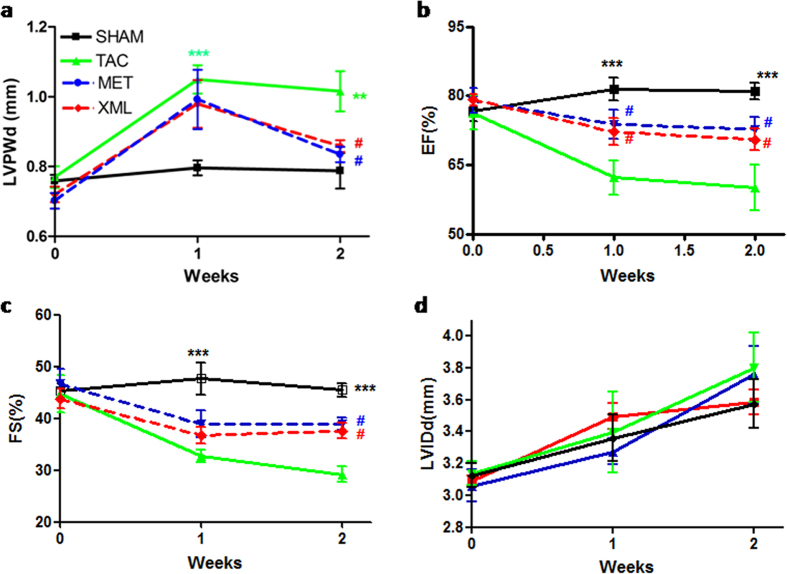
Figure 2. Dynamic changes in cardiac structure and function were detected by echocardiography in the SHAM, TAC, XML, and MET groups.
(a) LVPWd (b) EF (c) FS and (d) LVIDd were observed dynamically after 0, 1, and 2 weeks. **P < 0.01 and ***P < 0.001 indicate significant differences from SHAM. #P < 0.05 indicates significant difference from TAC group.

