
Figure 3. Genomic mosaicism of Pt-44772-G and Pt-B92-G prophages.
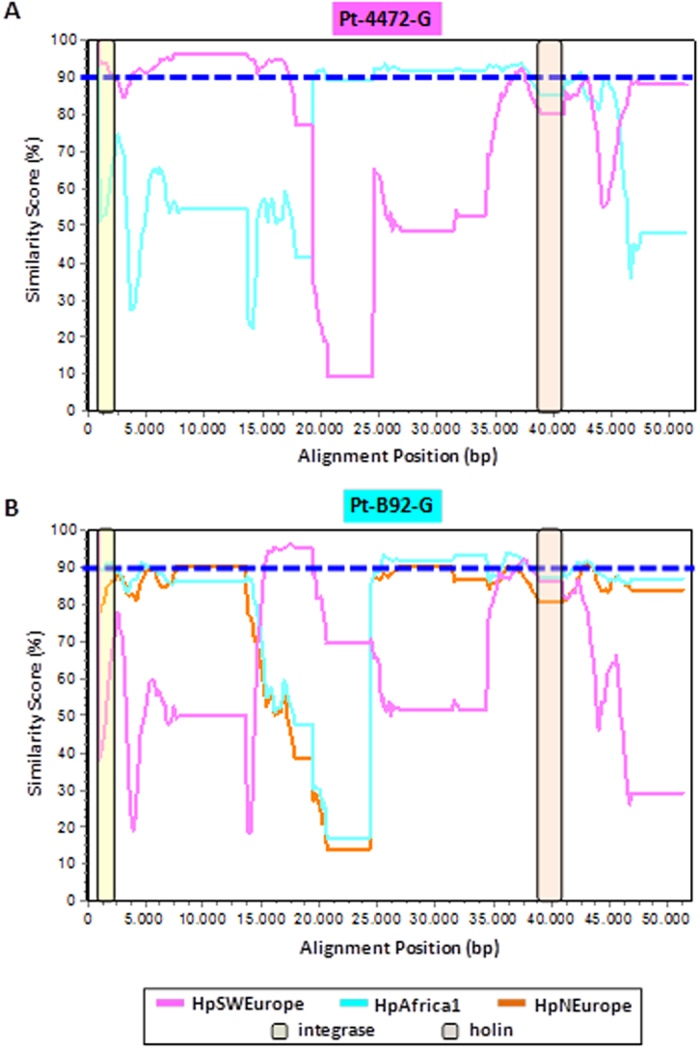
(A) SimPlot showing the genetic similarity of PT-4472-G (PST-classified as hpSWEurope) to both the hpSWEurope and hpAfrica1 populations. (B) SimPlot showing the genetic similarity of Pt-B92-G (PST-classified as hpAfrica1) to hpSWEurope, hpAfrica1 and hpNEurope populations. For both plots, the Kimura 2-paramter model was used to calculate nucleotide similarities in a sliding-window of 1500 bp and a step size of 150 bp, with gap strip on. Cut-off of 90% similarity is shown in a blue dashed-line.