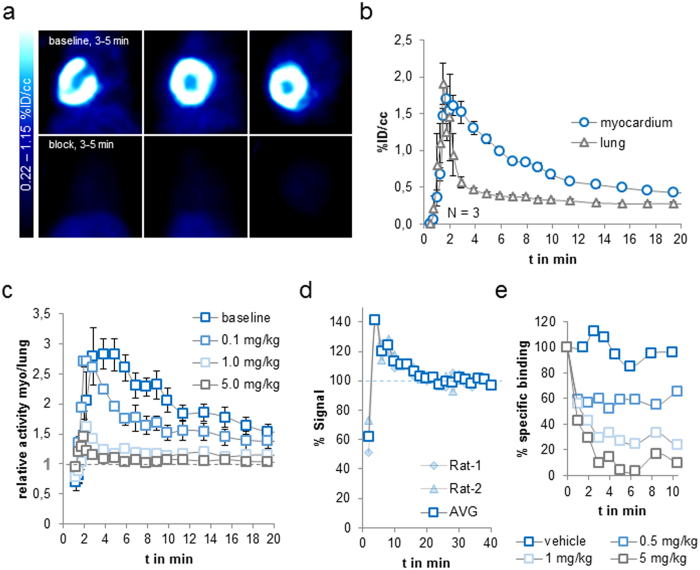
Figure 2. In vivo radiocaine mPET-imaging using healthy rats.
(a) Summed images (3–5 min) of rat myocardium after a i.v. bolus injection of 750 μCi radiocaine (top) or a 5 mg/kg dose i.v. lidocaine dissolved in saline five minutes before 1036 μCi radiocaine (bottom) (baseline animal was injected with an equivalent volume of saline). Images depict coronal, sagittal and transverse views of the rat thorax. (b) Time-activity-curves (TACs) of rat myocardium and lung (N = 3, error bars represent ± one Stdev). (c) Ratio of myocardium to lung over time and as a function of drug occupancy. Doses of 0.1, 1.0 and 5.0 mg/kg lidocaine or an equivalent volume of saline were injected i.v. 5 min before radiocaine injection (N = 3 for baseline, N = 2 for each dose, error bars represent ± one Stdev, two-way ANOVA analysis with replication and an alpha value of 0.001 delivered p = 4.04−22, allowing to conclude that the myocardium/lung ratio changes with ≥99.9% certainty as a function of drug occupancy). (d) Bolus + infusion paradigm. Radiocaine was injected i.v. followed by continuous syringe-pump infusion for 40 min (rate = 1 ml/hour). The signal represents the ratio of myocardium over lung and is normalized to the plateau after 20 min. (e) Bolus + Infusion paradigm with in-scan lidocaine challenge. Using an additional i.v. line, vehicle or increasing concentrations of lidocaine (0.5–5 mg/kg) were injected. Specific binding is calculated as the myocardium/lung ratio at the TAC-plateau minus the same ratio after injection of a 5.0 mg/kg lidocaine dose. Each trace represents one animal (N = 4).

