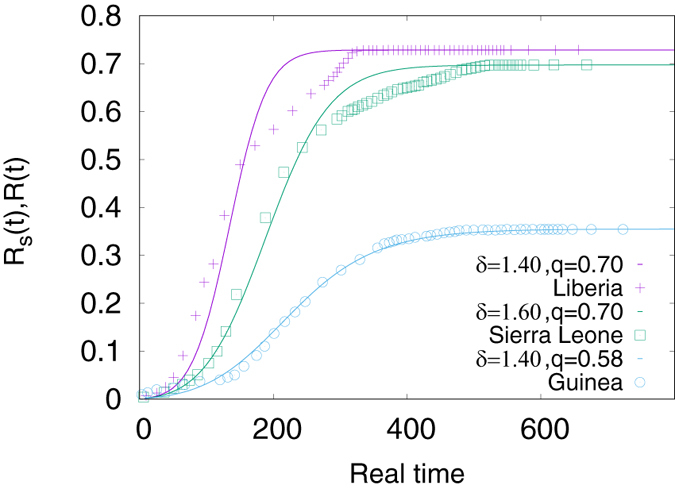
Figure 4. Solid curves are for the fraction of population infected (simulated data) R(t) as a function of real time (rescaled Monte Carlo time step) for different pairs of infection rate q and δ.

The rescaling factors for the MC time steps are 8.0 for Liberia, 9.0 for Sierra Leone and 9.2 for Guinea. Data points are for the rescaled fraction of population infected (real data) Rs(t) as a function of real time for the three countries Guinea, Liberia and Sierra Leone.
