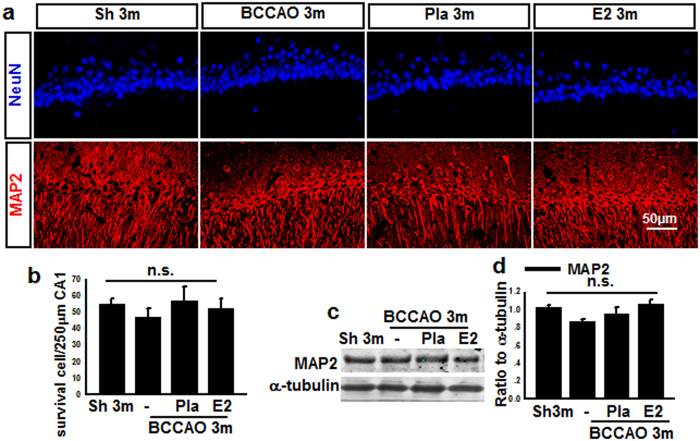
Figure 2. Effects of E2-treatment upon neuronal markers (NeuN, MAP2) in hippocampal CA1 region at 3 months after BCCAO.
(a) Sections from sham (Sh) 3 m, BCCAO 3 m, Placebo (Pla) 3 m, and E2-treatment 3 m were subjected to immunofluorescent staining for NeuN (Blue), and MAP2 (Red). (b) Quantify for NeuN-positive cells in 250 μm length of the medial CA1 pyramidal cell layer. n = 15. (c, d) Western blot showed that MAP2 protein expression had no significant change in all groups. n.s. means no significant change between the four groups; n = 5–6, scale bar is 50 μm; magnification is 40×.

