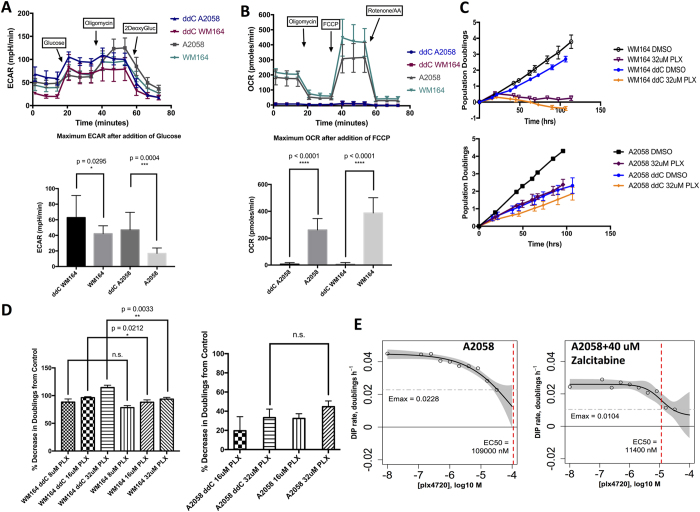
Figure 4.
(A) Extracellular pH or acidification rate of parental A2058 and WM164, and their ddC/zalcitabine treated counterparts (40 uM zalcitabine); bar plot showing maximum ECAR after adding glucose (10 mM), with t-test between parental and ddC treated cells. (B) Oxygen consumption rate of parental A2058 and WM164, and their ddC/zalcitabine treated counterparts (40 uM zalcitabine); bar plot showing maximum OCR after adding FCCP (1 uM), with t-test between parental and ddC treated cells. (C) Log2 normalized proliferation of ddC treated WM164 (top panel) or ddC treated A2050 (lower panel). (D) Quantification of percent decrease in Doublings from respective DMSO controls for WM164 and A2058 cell line (not statistically significant). (E) Drug Induced Proliferative (DIP) metric dose response curves (non-normalized) marking model estimated EC50 values in nM (red dashed vertical line), and model estimated Emax values (grey dashed horizontal line).

