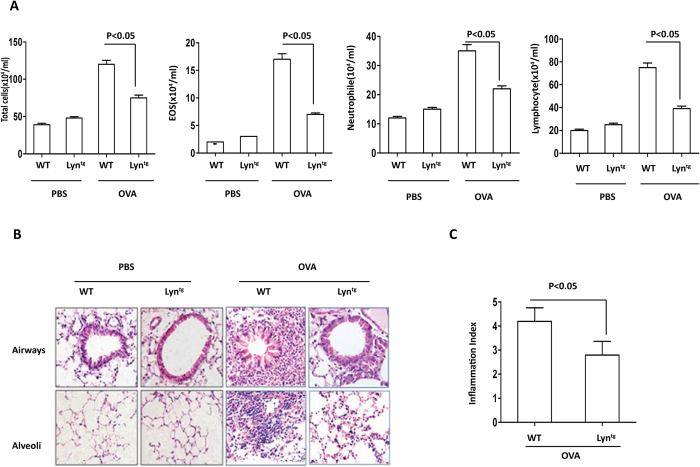
Figure 2. Airway inflammation in OVA-challenged Lyntg mice.
(A) The total number of inflammatory cells as well as eosinophils, neutrophils and lymphocytes in the BAL of the WT and Lyntg mice were determined by differential cell analysis. (B) The lung tissues were stained using H&E (original magnification, x200). (C)The inflammatory cell infiltration index was determined in the lungs in (B) (10 random areas).

