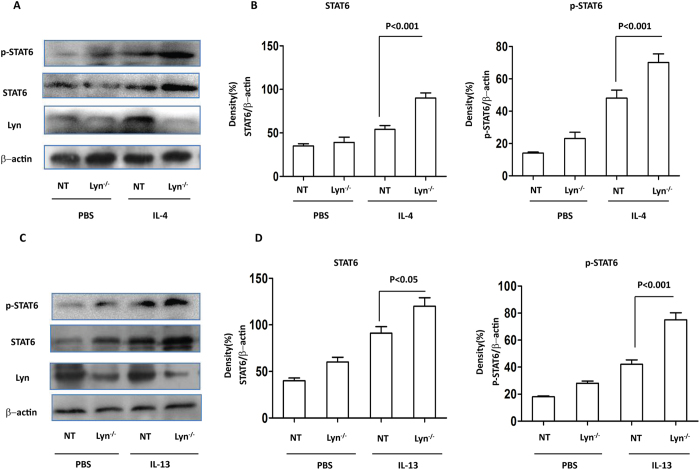
Figure 6. The expression and phosphorylation of STAT6 in IL-4/IL-13- challenged Lyn/− 16HBE cells.
The 16HBE cells were transfected with Lyn siRNA. (A) Western blot analysis of Lyn, STAT6 and the phosphorylation of STAT6 in Lyn−/− and untransfected (NT) cells exposed to IL-4. (B) Relative density of STAT6 and phosphorylation of STAT6 in IL-4-treated Lyn knockdown and NT cells. (C) Western blot analysis of Lyn, STAT6 and phosphorylated STAT6 in Lyn−/− and NT cells exposed to IL-13. (D) Relative density of STAT6 and phosphorylated STAT6 in IL-13-treated Lyn−/− and NT cells. β-actin was used as the loading control. All data are representative of three experiments, and a statistical analysis was performed.

