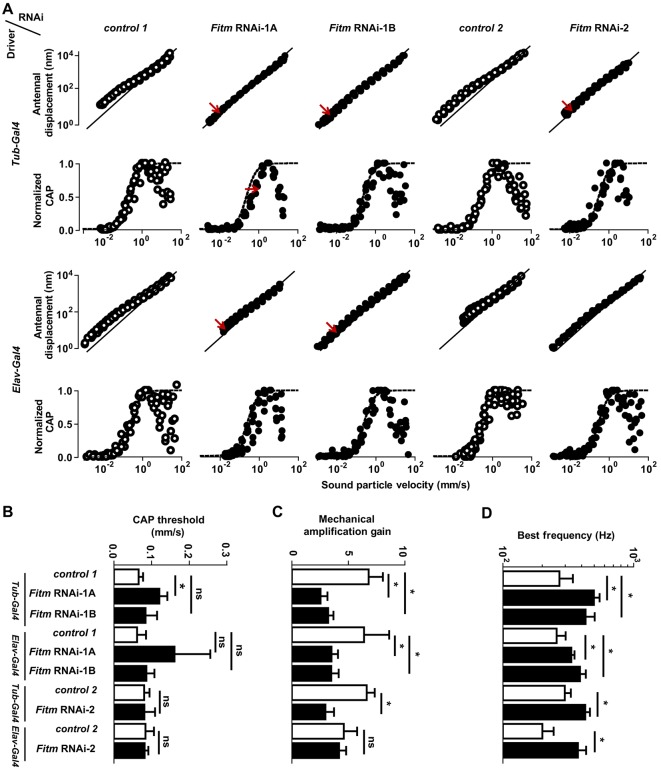
Fig. 5.
Knockdown of Fitm impairs Drosophila hearing. Antennal vibrations and ensuing antennal nerve potentials were measured in the Fitm RNAi-1A, Fitm RNAi-1B and Fitm RNAi-2 lines and the corresponding controls (Control-1 and Control-2) crossed to the pan-neuronal elav-GAL4 and ubiquitous αTub84B-GAL4 drivers three days after eclosion. (A) Sound-evoked antennal displacement amplitudes (upper panels, log scale) and normalized compound action potential (CAP) amplitudes as functions of the sound particle velocity. Each circle indicates a single data point. Solid (upper panels) and dashed (lower panels) lines indicate linear auditory mechanics, as observed upon the loss of mechanical amplification by auditory sensory neuron motility (Senthilan et al., 2012), and Hill fits to the pooled CAP responses of each strain, respectively. Red arrows indicate significant differences to controls. (B) Respective CAP thresholds, deduced from Hill fits to the CAP amplitudes of each individual. (C) Respective mechanical amplification gains provided by auditory sensory neuron motility. (D) Respective mechanical best frequencies of the antennal sound receivers, deduced from the mechanical fluctuations in the absence of sound stimulation (Senthilan et al., 2012). Per strain, five flies were analyzed and three independent measures were taken. Each data point represents the average response to 10 stimulus presentations. Error bars indicate s.d. *P<0.05; ns, not significant by two-tailed Mann–Whitney U-tests. If applicable, Bonferroni correction was used to correct for multiple testing. For original values, see Table S12.

