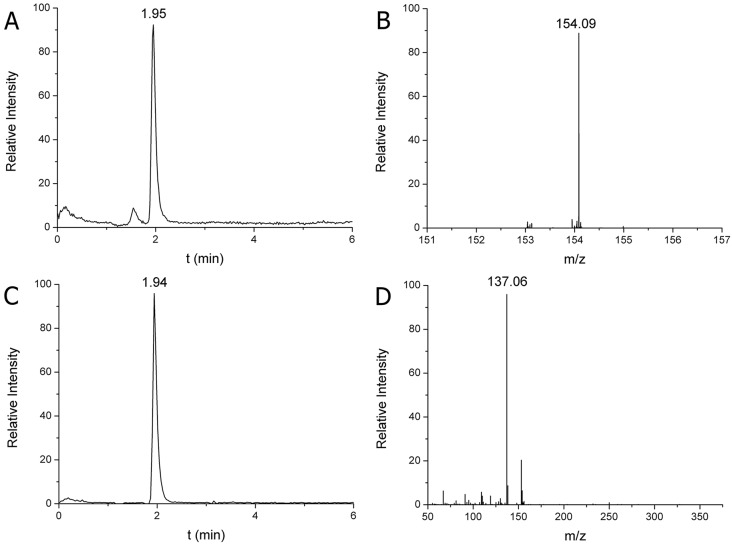
Fig. 1.
HPLC-MS analysis of DA in SN of the rat. (A) Extracted ion chromatogram of DA at 1.95 min retention time in single ion monitoring (SIM) mode. (B) MS spectrum of DA identified at 154.09 m/z parent ion protonated form [M+H]+. (C) Extracted ion chromatogram of DA fragment at 1.94 min retention time in MS/MS mode. (D) MS/MS spectrum of DA identified at 137.06 m/z fragment ion protonated form [F+H]+ (219 fmol DA was injected). The calculated DA content was 3.87 µg/g SN tissue.

