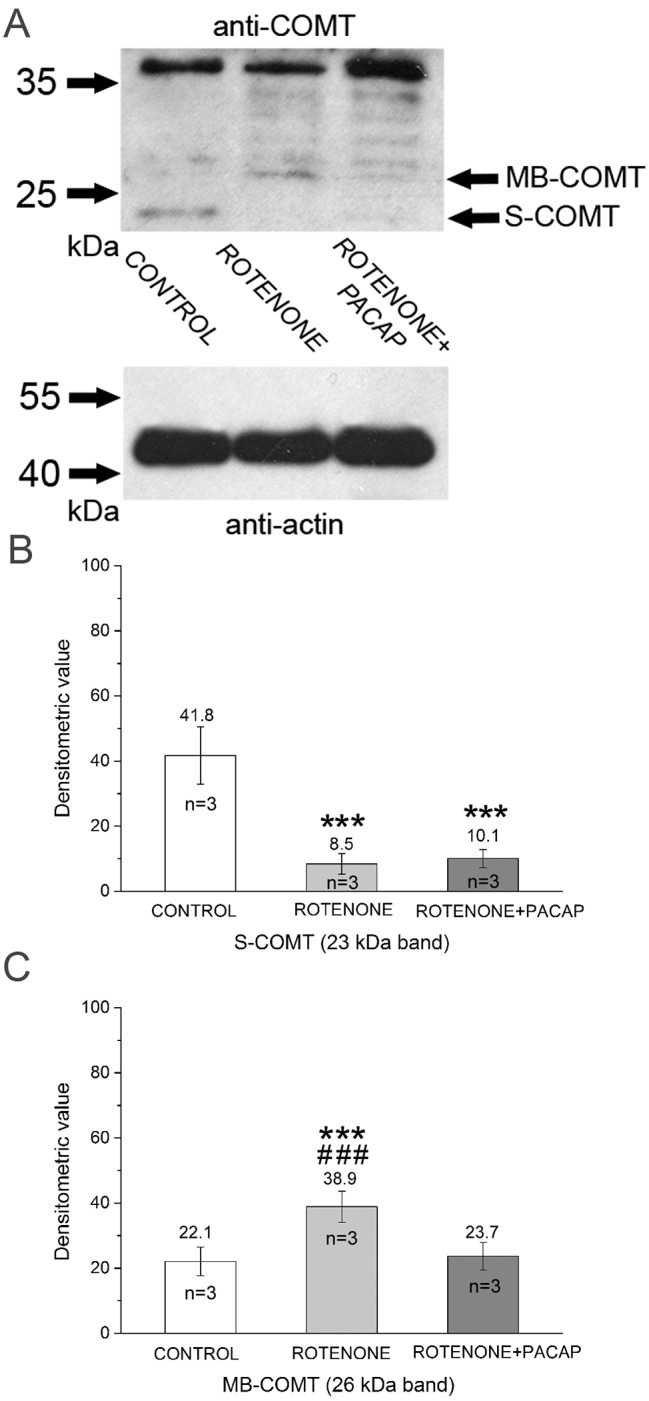
Fig. 5.

Analysis of DA metabolic enzymes in snail brain homogenates. (A) Western blot with anti-COMT. The bottom panel shows detection of anti-β-actin as a loading control. The top panel shows S- and MB-COMT localization at ∼23 and 26 kDa. A non-linear adjustment (+0.5% level adjustment) was applied to the MB-COMT band in rotenone group. Densitometry evaluations of S-COMT (B) and MB-COMT (C) (n=3, calculated from independent WB experiments). S-COMT: F(2)=135.80, P<0.001; post hoc test between control and rotenone groups (P<0.001), control and rotenone+PACAP groups (P<0.001). MB-COMT: F(2)=50.68, P<0.001; post hoc test between control and rotenone (P<0.001), rotenone and rotenone+PACAP groups (P<0.001). ***P<0.001 between control and treated groups; ###P<0.001 between rotenone and rotenone+PACAP groups.
